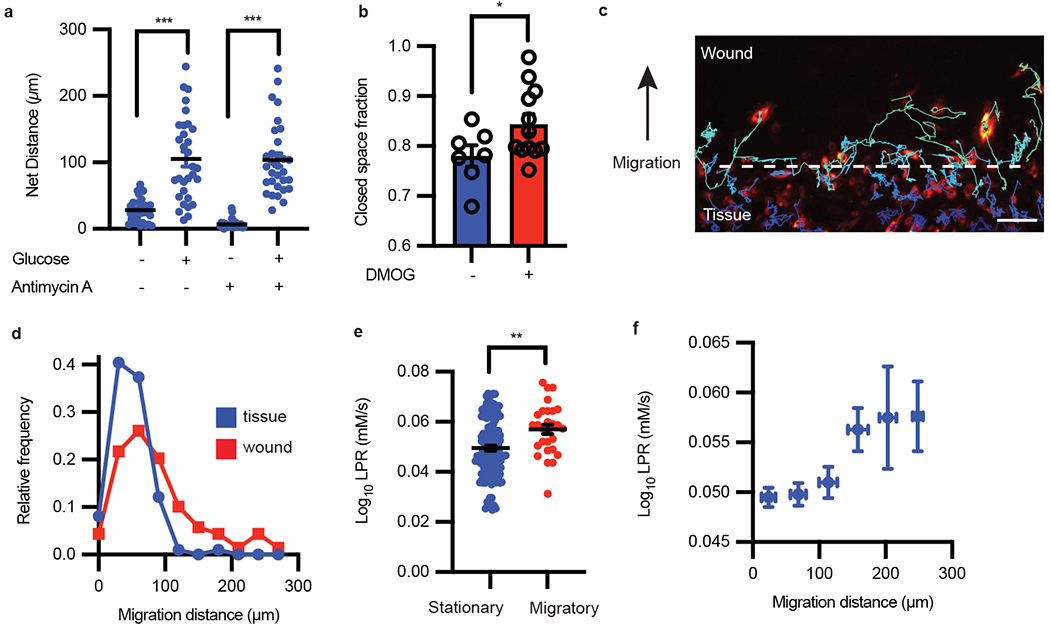
Figure 3: Single-cell metabolism links migratory cell phenotypes to glycolysis states.

a, Migration distance of HAECs with or without glucose and with or without antimycin A (n = 31 cells each condition; error bars are SEM, p < 0.0001 for both pairs of conditions). b, Migration scratch assay quantification with and without DMOG treatment (n = 7 and 12, respectively; error bars are SEM, p = 0.0474). c, Migrating endothelial cells (false color) were tracked for 48 hours following wound formation. Scale bar = 150 μm. d, Frequency distribution of cell migration distance in the wound vs tissue. e, The LPR of cells that migrated less than 50 μm compared to cells that migrated more than 200 μm (cell number n = 141 and 28, respectively; error bars are SEM, p = 0.0012). f, The LPR change as a function of cell migrated distance (n = 114, 118, 42, 12, 8 from low to high migration distance; error bars are SEM). Statistical significance was determined by two-sided Welch’s t-test.
