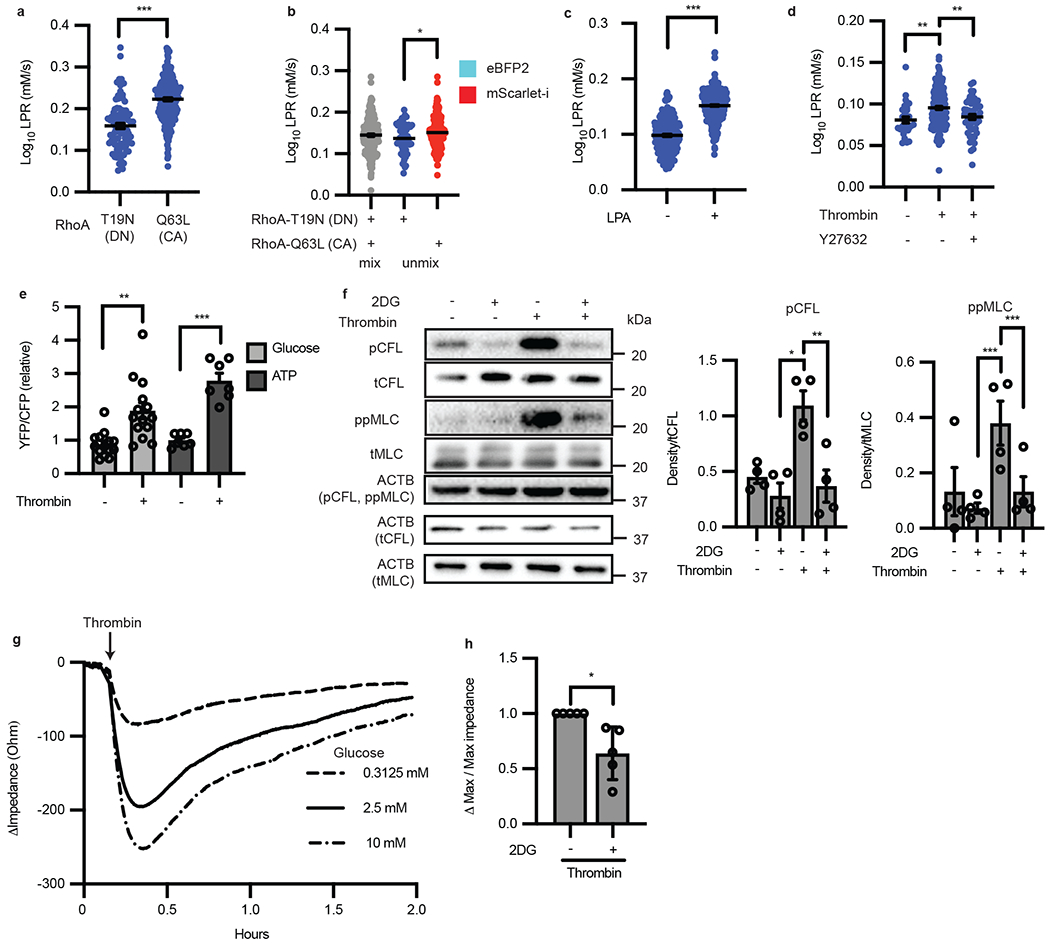
Figure 4: Single-cell imaging of lactate production reveals RhoA drives endothelial cell glycolysis, which is necessary for contractions.

a, LPR of HAECs transfected with either RhoA-T19N (dominant negative “DN” form) or RhoA-Q63L (constitutively active “CA” form). (n = 91, 250 respectively, p < 0.0001). b, RhoA-Q63L-mScarlet-i transfected ECs have increased LPR compared to those transfected with RhoA-T19N-eBFP after unmixing by color (n = 52 and 174, respectively, p = 0.0193). c, LPR of HAECs treated with control (DMSO “−”) or 10 μm of lysophosphatidic acid for 30 min. (n = 244 and 423 respectively, p < 0.0001). d, Thrombin induced LPR (n = 171) compared to control (n = 28, p = 0.0028) which is suppressed with Y27632 (n = 51, p = 0.0042). e, Glucose and ATP levels before and after treatment with thrombin measured by FRET (n = 14 cells glucose, p = 0.0012; n = 7 cells ATP, p = 0.0001). f, Western blot of 2DG pre-treatment in the presence or absence of thrombin and phosphorylation of cofilin and MLC (n = 4 biological replicates. For pCFL, p = 0.008 for thrombin vs. 2DG and p = 0.0038 for thrombin vs thrombin + 2DG. For ppMLC, p < 0.0001 for both thrombin vs 2DG and thrombin vs thrombin + 2DG). Loading control (ACTB) each protein denoted in parentheticals. Original blot in Source Data a. g, TEER trace of HAECs after thrombin treatment in different extracellular glucose conditions. h, Inhibition of hexokinase with 2-DG reduces thrombin-induced permeability as measured by TEER (n = 5 each; biological replicates, p = 0.0283). Statistical significance determined by two-sided Welch’s t-test (a, b, c, e, h) or by one-way ANOVA followed by Bonferroni test (d, f). All error bars are SEM.
