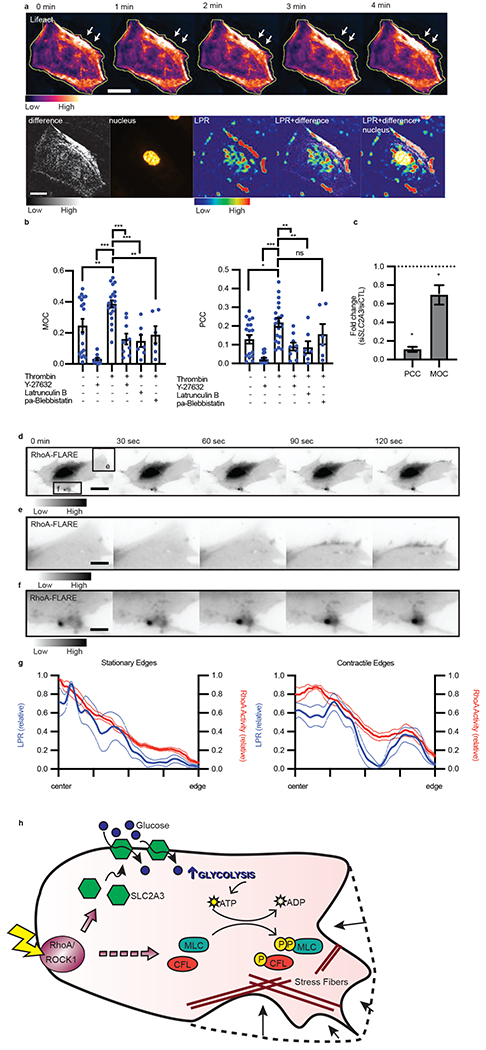
Figure 6: Subcellular distribution of LPR colocalizes with actin remodeling.

a, Representative montage of endothelial cell actin structure, as labeled with Lifeact-RFP, where the yellow line indicates original cell edge and white arrows point to contractile edge after treatment with thrombin (n = 14 biological replicates, 3 separate experiments). Maximum projection of change in actin structure (difference), nucleus, per pixel LPR map (LPR), and merges. Scale bar = 30 μm. b, MOC and PCC of unstimulated or stimulated cells in the presence of ROCK inhibitor (Y-27632), actin polymerization inhibitor (Latrunculin B), and myosin II inhibitor (paBlebbistatin: para-aminoblebbistatin), error bars are SEM. (n = 15, 14, 20, 9, 7, 6 from left to right. Thrombin vs. control, p = 0.0035; vs. Y27632, p < 0.0001; vs. thrombin + Y27632, p < 0.0001; vs. thrombin + latrunculin B. p = 0.0002; vs. thrombin + para-aminoblebbistatin, p = 0.0040). c, Fold change of PCC or MOC of thrombin treated cells under SLC2A3 knockdown compared to siCTRL, all error bars are SEM. (n = 14 for both, p = 0.0317 for PCC, p = 0.0151 for MOC). d, RhoA activity measured by RhoA-FLARE in a contracting endothelial cell (scale bar = 15 μm). e-f, Regions (e) and (f) from (d) demonstrate high RhoA activity in areas of active contraction (scale bar = 4.5 μm) (d-f representative of n = 9 cells, 3 biological replicates). g, Normalized LPR and RhoA activity distribution from cell center to edge of non-contractile/stationary edges and contractile/motile edges stimulated with thrombin. (LPR stationary, n = 4; RhoA stationary, n = 6; LPR contract, n = 8; RhoA contract, n = 9). Dotted lines are standard deviation. h, Proposed mechanism of RhoA regulating glycolysis and contraction. Agonism of RhoA/ROCK1 stimulates SLC2A3 translocation to the membrane to increase intracellular glycolysis, thereby providing the substrate for phosphorylation of downstream targets (MLC and CFL), resulting in stress fiber formation and, ultimately, contraction. Statistical significance was determined by one-way ANOVA followed by Bonferroni test (b) or by two-sided Welch’s t-test (c).
