Figure 4.

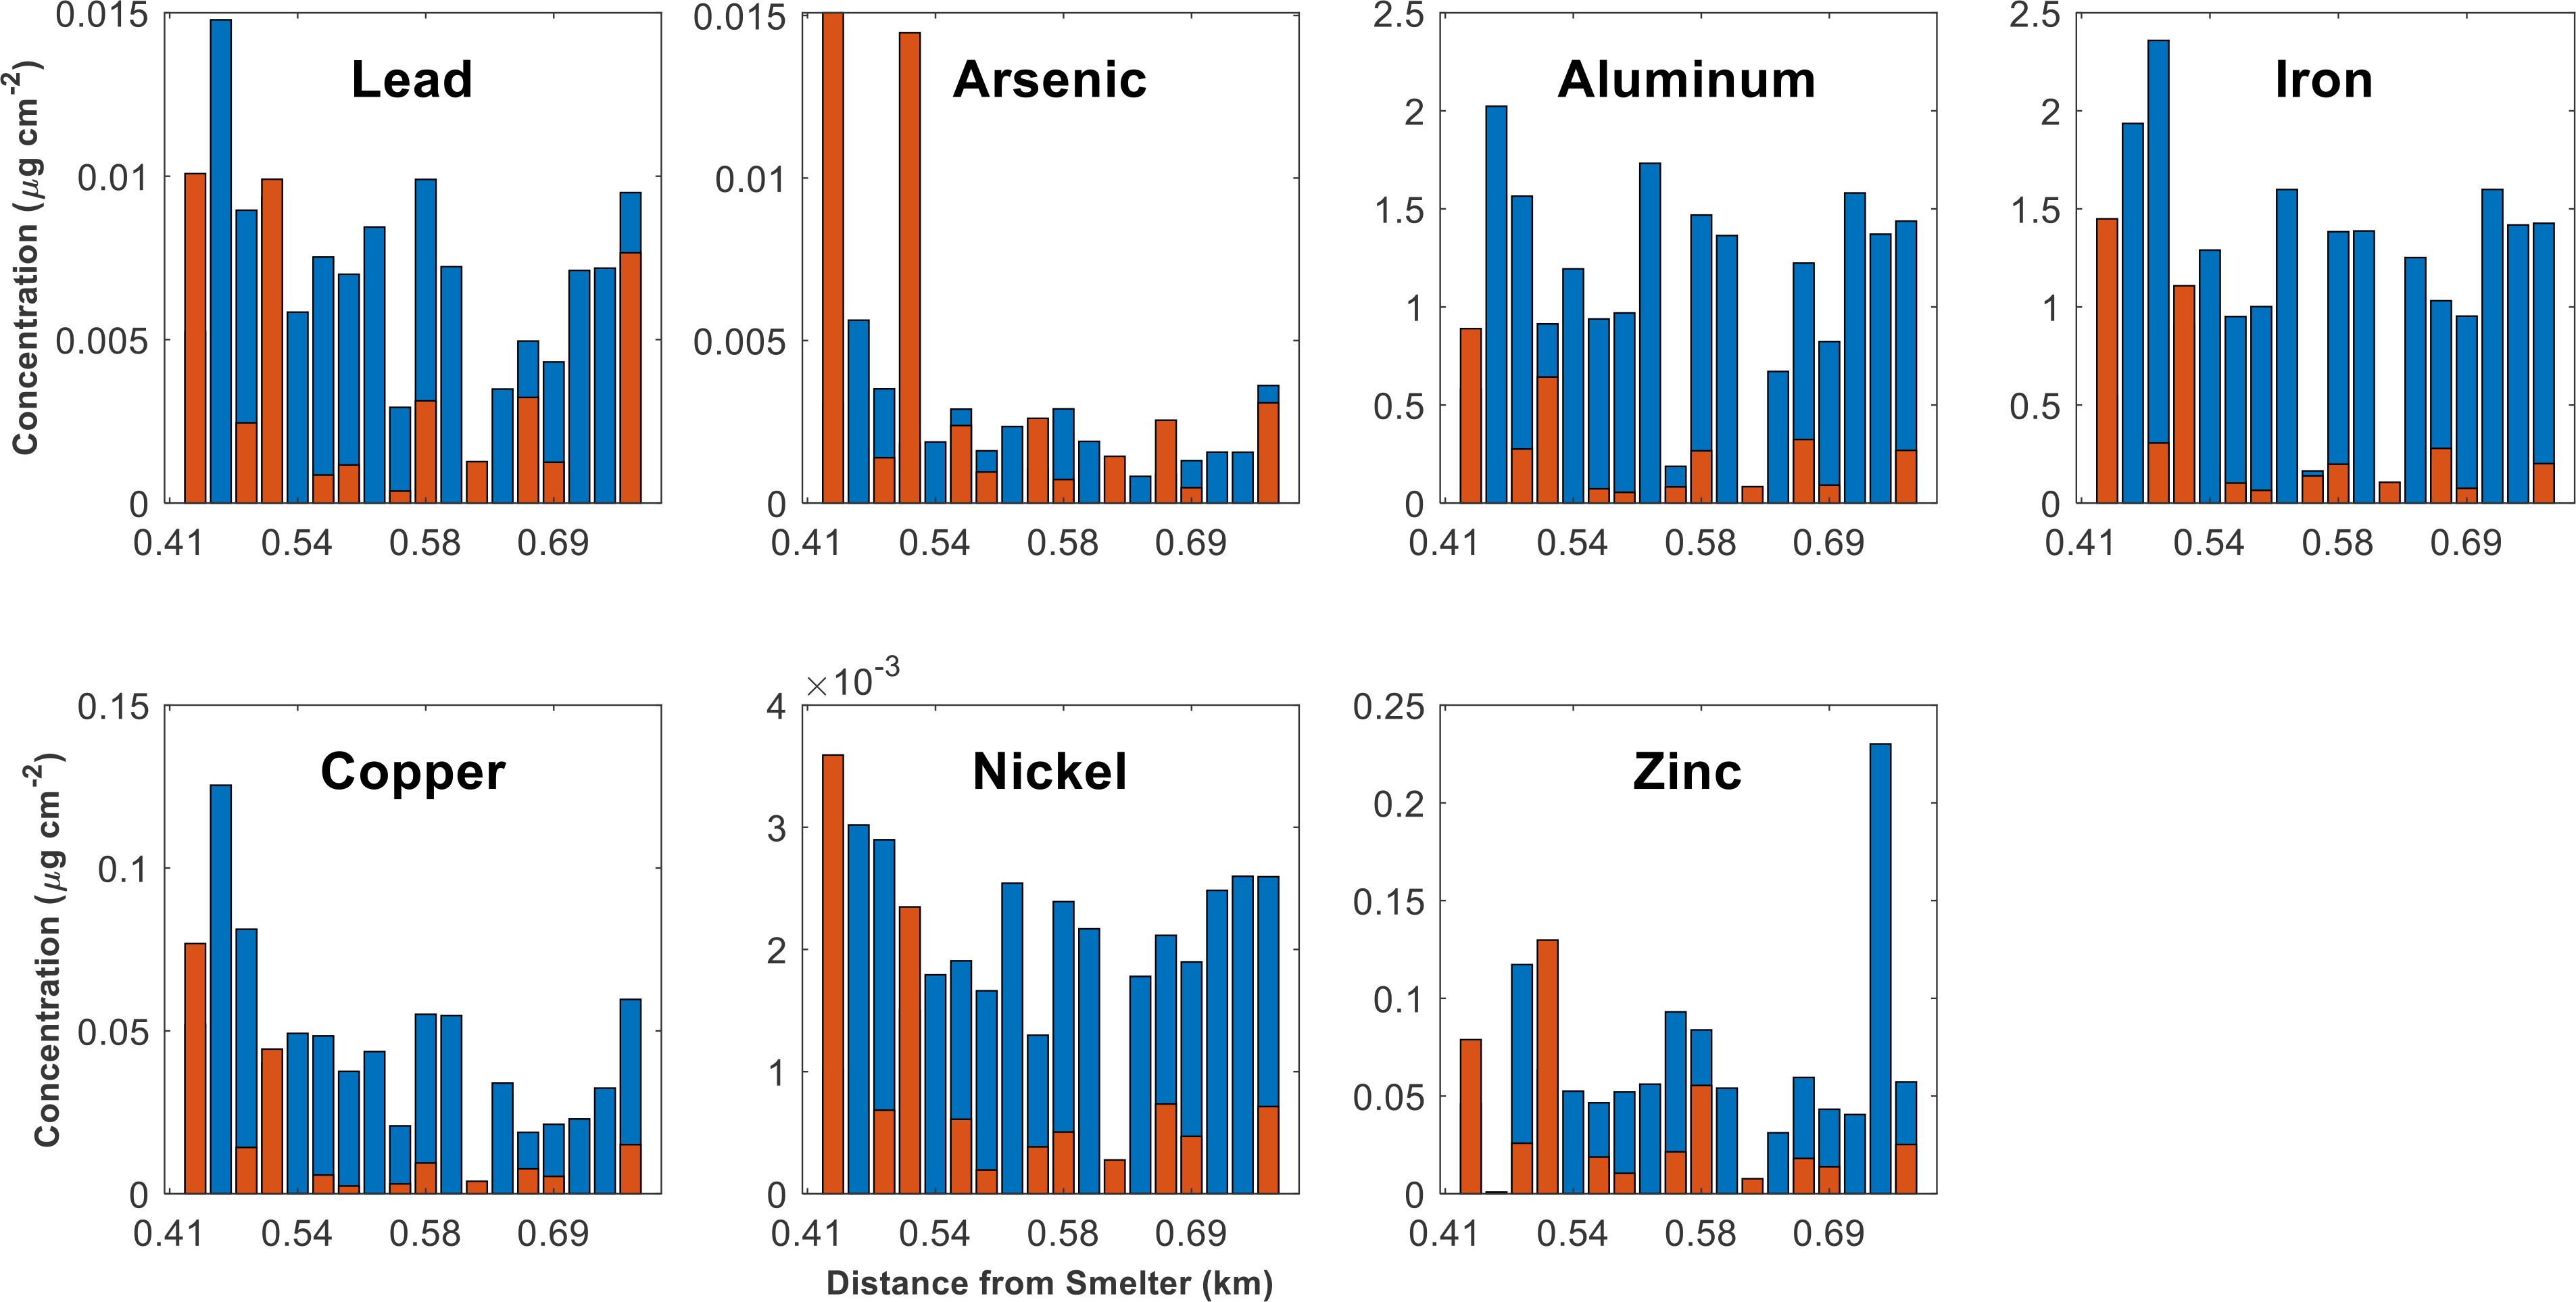
Concentration (μg cm−2) versus distance (km) from the smelter for each metal(loid) of interest. The blue bars represent the frisbee concentrations and the orange bars represent the foliar concentrations.

Concentration (μg cm−2) versus distance (km) from the smelter for each metal(loid) of interest. The blue bars represent the frisbee concentrations and the orange bars represent the foliar concentrations.