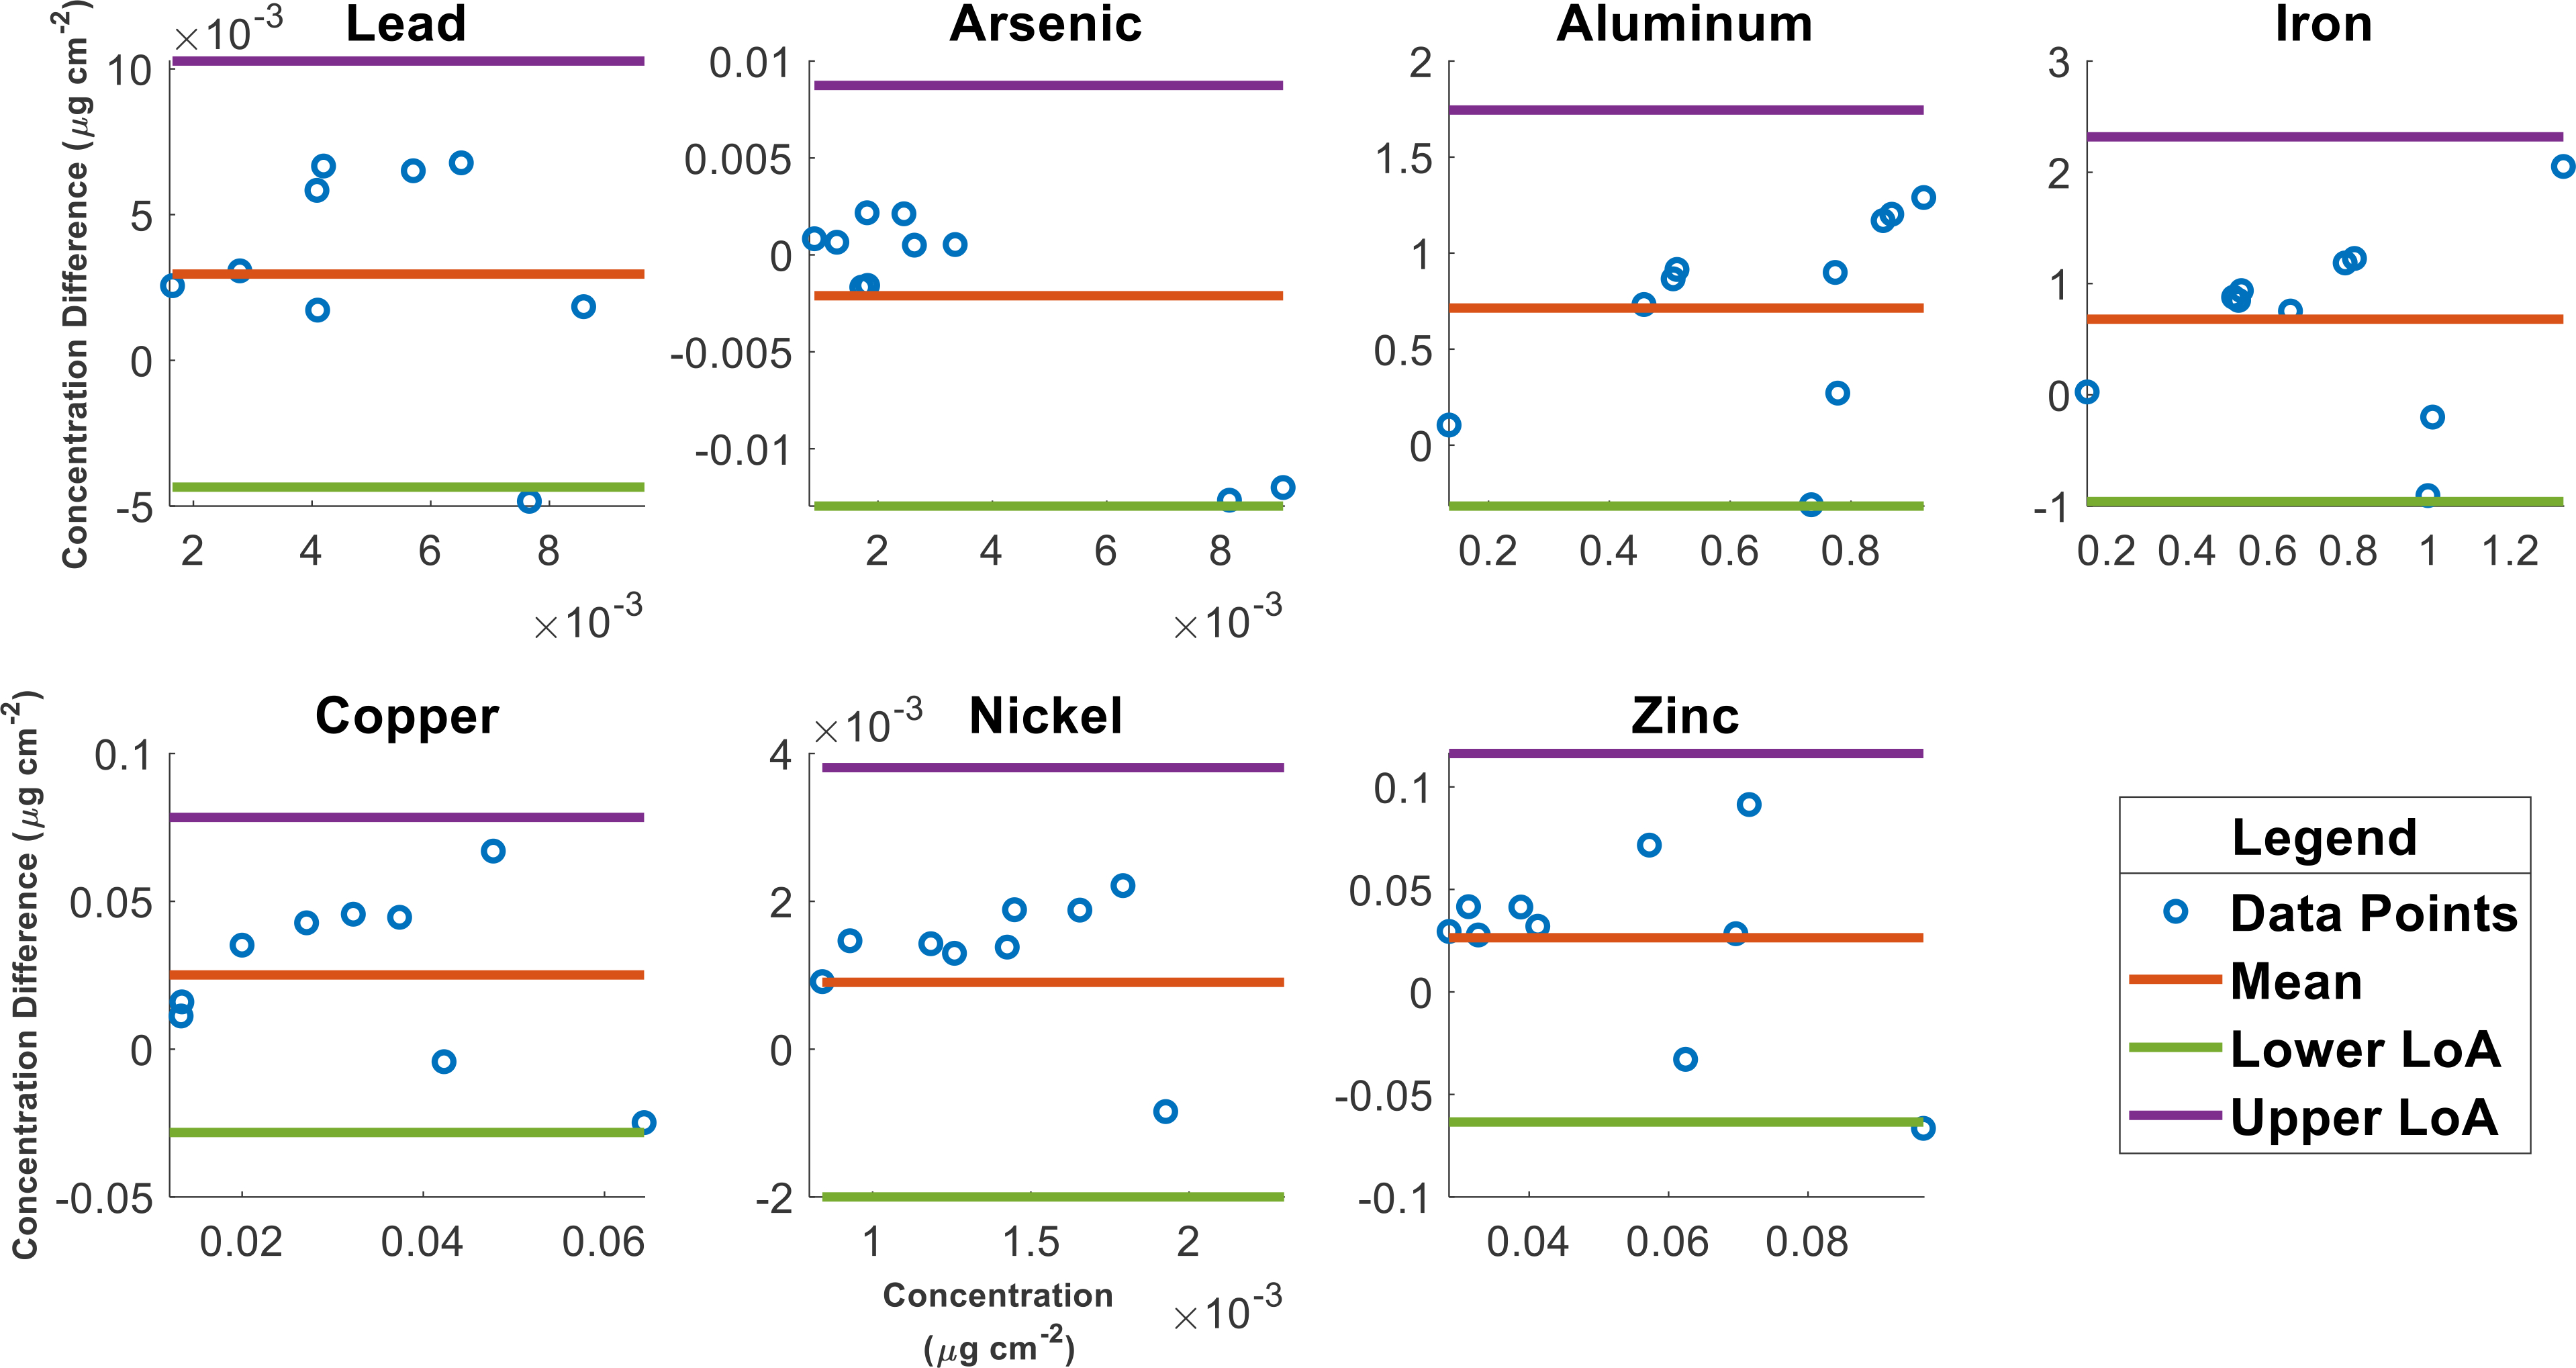
Figure 5.

Bland-Altman plots for each metal(loid) of interest. The x-axis represents the average metal(loid) concentration at a specific distance for both methods and the y-axis represents the difference between the concentration for that distance. The upper and lower limits of agreement (LoA) indicate the range in which 95% of the values from the dataset lie.
