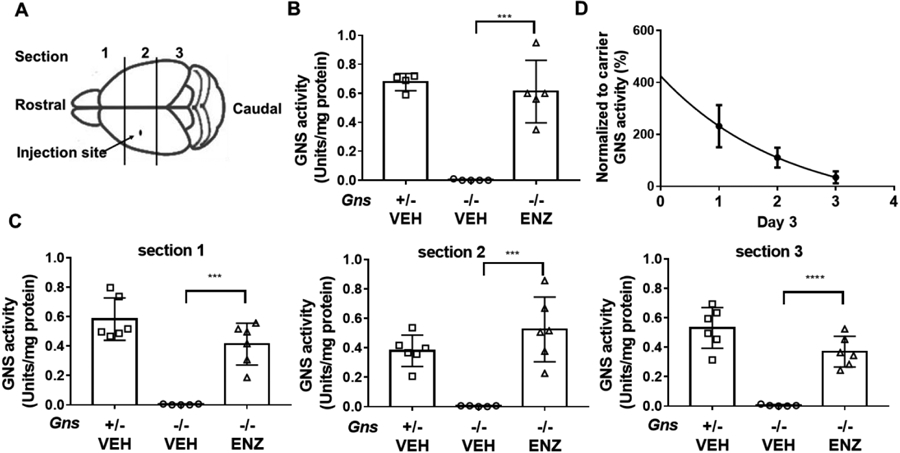
Figure 6.

ICV injection of rhGNS in MPS IIID (Gns−/−) mice. A) Schematic of neonatal mouse brain showing the site of injection. B) GNS activity in mouse brain lysate 1 day after treatment, Gns+/− VEH (n=4), Gns−/− VEH (vehicle treated, n=5), Gns−/− ENZ (rhGNS treated, n=5). C) rhGNS distribution in 3 sections of the brain as determined by GNS activity in mouse brain lysate 1 day after treatment in 3 sections. Gns+/− VEH (n=6), Gns−/− VEH (n=5), Gns−/− ENZ (n=6.) D) Estimated half-life of rhGNS in the mouse brain. GNS activity in whole brain lysate 1, 2, and 3 days after treatment with a single dose of 201 units rhGNS delivered ICV at PND 2 of Gns−/− mice. Decay plot of GNS activity in treated mice to estimate the half-life of rhGNS, n= 6. Data was shown as mean ± SD, and individual animal means are indicated by symbols. Statistical analysis was performed using one-way ANOVA.*** p < 0.001; **** p < 0.0001.
