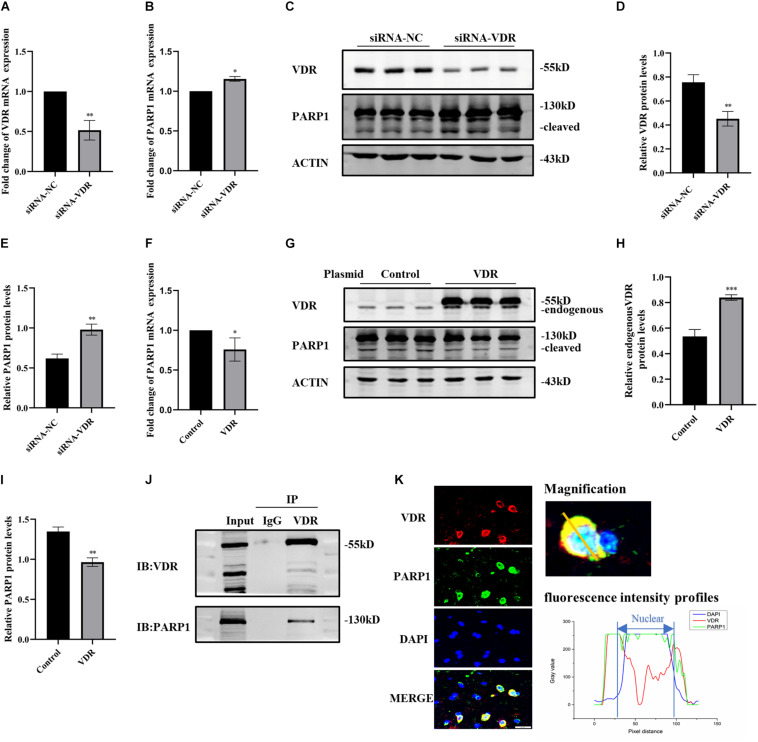
FIGURE 5.
The interaction between VDR and PARP1. SH-SY5Y cells were transferred with siRNA of VDR or negative control; VDR and PARP1 levels were assessed by real-time PCR (A,B) and western blotting (C). Quantification of VDR (D) and PARP-1 (E) expressions. SH-SY5Y cells were transferred with VDR overexpression plasmid or negative-control plasmid; PARP1 levels were assessed by real-time PCR (F). VDR and PARP1 levels were assessed by western blotting (G) and quantified (H,I). Coimmunoprecipitation shows the binding of VDR and PARP1 (J). Fluorescence colocalization analysis of VDR and PARP1 in sections (K). Data are shown as mean ± SEM, based on three independent experiments, *p < 0.05, **p < 0.01, ***p < 0.001.

