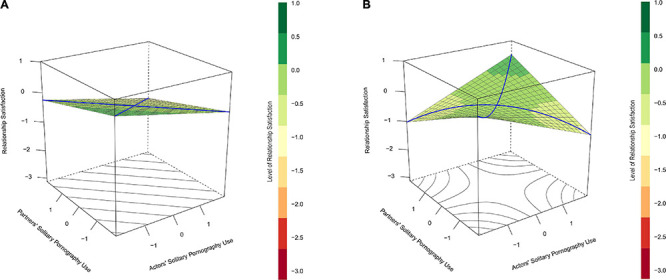
FIGURE 1.

(A) Depicts the prediction of relationship satisfaction (vertical axis) with actors’ and partners’ solitary pornography use (horizontal axes) without an interaction between these components. In this case, the plot indicates that as both actors’ and partners’ solitary pornography use increase (the back left-most corner of the plot), participants’ relationship satisfaction decreases. Note that the line of incongruence (the blue line running from left to right of this plot) is a straight line when no interaction is present in the data. The lack of curve in this line indicates the absence of similarity-dissimilarity effect in the data. In contrast, (B) depicts the hypothesized similarity-dissimilarity effect by illustrating the prediction of relationship satisfaction with an interaction between actors’ and partners’ solitary pornography use. Unlike the illustration in (A), this plot indicates that participants’ relationship satisfaction decreases as their own solitary pornography use (i.e., actors’ solitary pornography use) increases, but only when their partners’ solitary pornography use is low. Furthermore, the line of incongruence in this example is curved rather than straight, which indicates that a similarity-dissimilarity effect is present in the data. With respect to this line, relationship quality is lower at both extreme ends, when one partner uses pornography alone very frequently and the other does not, than at the midpoint, when both partners use pornography alone at a modest frequency.
