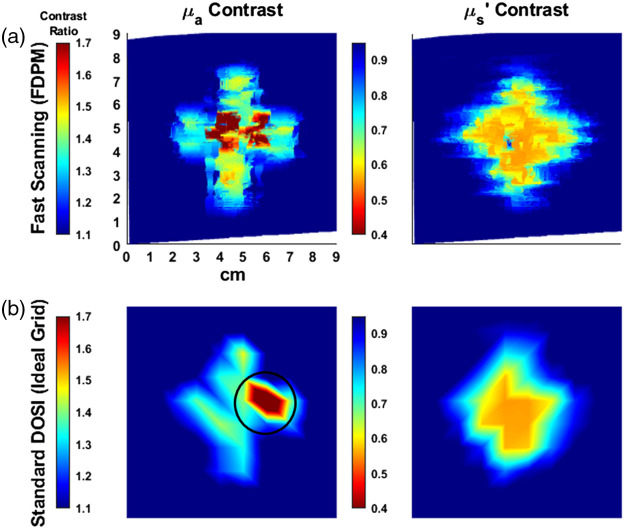
Fig. 2.
Pixel to background contrast ratio images of the absorption and reduced scattering maps at 808 nm at (in units). (a) Images were captured by manually raster scanning the surface of the phantom within a defined perimeter. The background was calculated by averaging the data using 1 cm squares at the four corners of the image. (b) Sparse-sampled data simulating a 1-cm grid image as captured in a discrete grid acquisition. Only one of two pinholes were detected (circled) due to the location of the sampling points.

