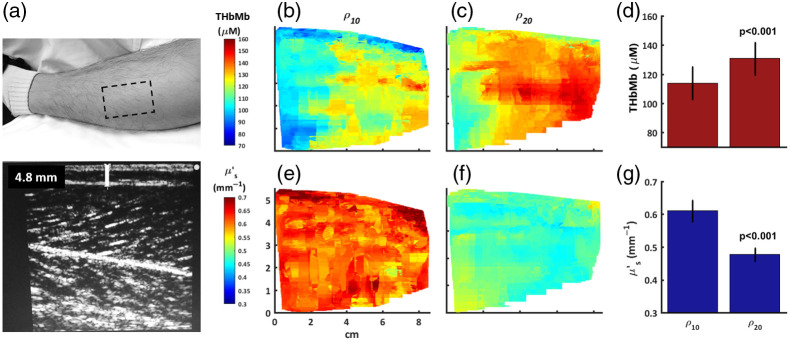
Fig. 3.
The calf of a healthy male subject imaged at and . (a) Photograph of the imaging area (dotted box). Ultrasound at the center of the imaged area measured a skin-adipose layer of 4.8 mm. (b) THbMb of the imaged area at with an average value of (c) THbMb of the imaged area at with an average value of . (d) The mean and standard deviation of THbMb for and . The rank sum test supports that the THbMb distributions were different (). (e) of the imaged area at with an average value of ; (f) of the imaged area at with an average value of . (g) The mean and standard deviation of for and . The rank sum test supports that the distributions were different ().

