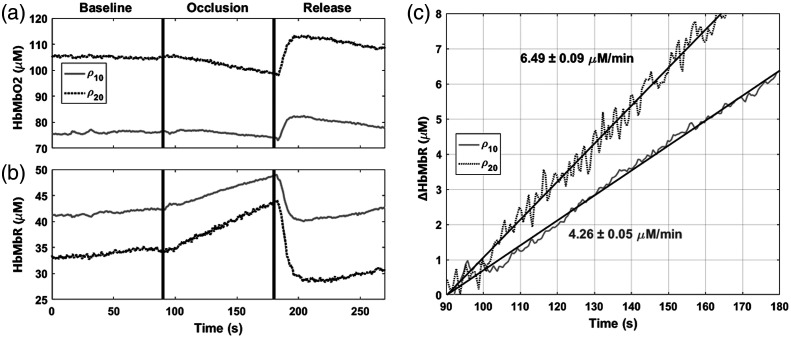
Fig. 4.
A calf occlusion was performed while measuring and in a single probe. (a) HbMbO2 dynamics at (black dashed) and (gray solid) during 90 s of occlusion and release. (b) HbMbR dynamics at and . (c) The rate and 95% confidence interval of HbMbR conversion was calculated during the 90 s occlusion period.

