Fig. 5.
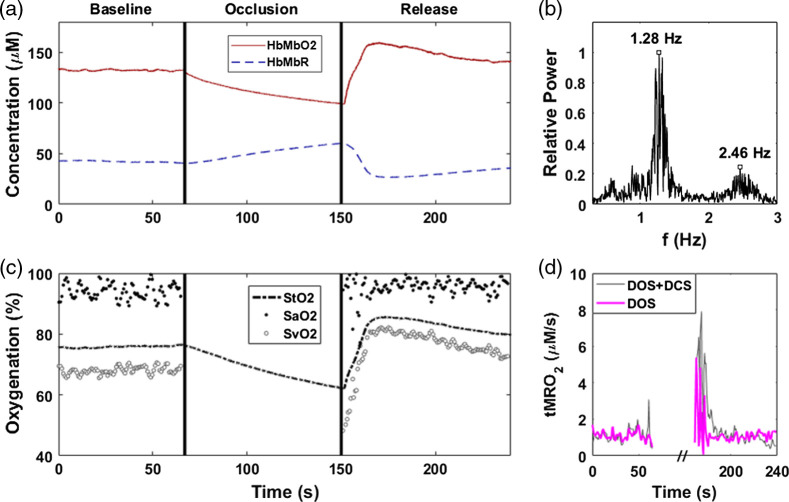
A thenar occlusion was performed on a healthy male subject. (a) HbMbO2 (red) and HbMbR (dashed, blue) dynamics are shown. The hemoglobin values were calculated provided H2O and FAT quantification by BB-DOSI. (b) Normalized frequency power spectrum with a 1.28-Hz peak representing heart rate and a 2.46-Hz peak for the first harmonic of the heart rate. (c) StO2 (dashed), SaO2 (black dots), and SvO2 (white circles) were calculated during baseline and release. (d) tMRO2 calculated using MM-DOSI (magenta line) and tMRO2 using BB-DOSI with DCS-provided flow from a secondary occlusion (gray line).

