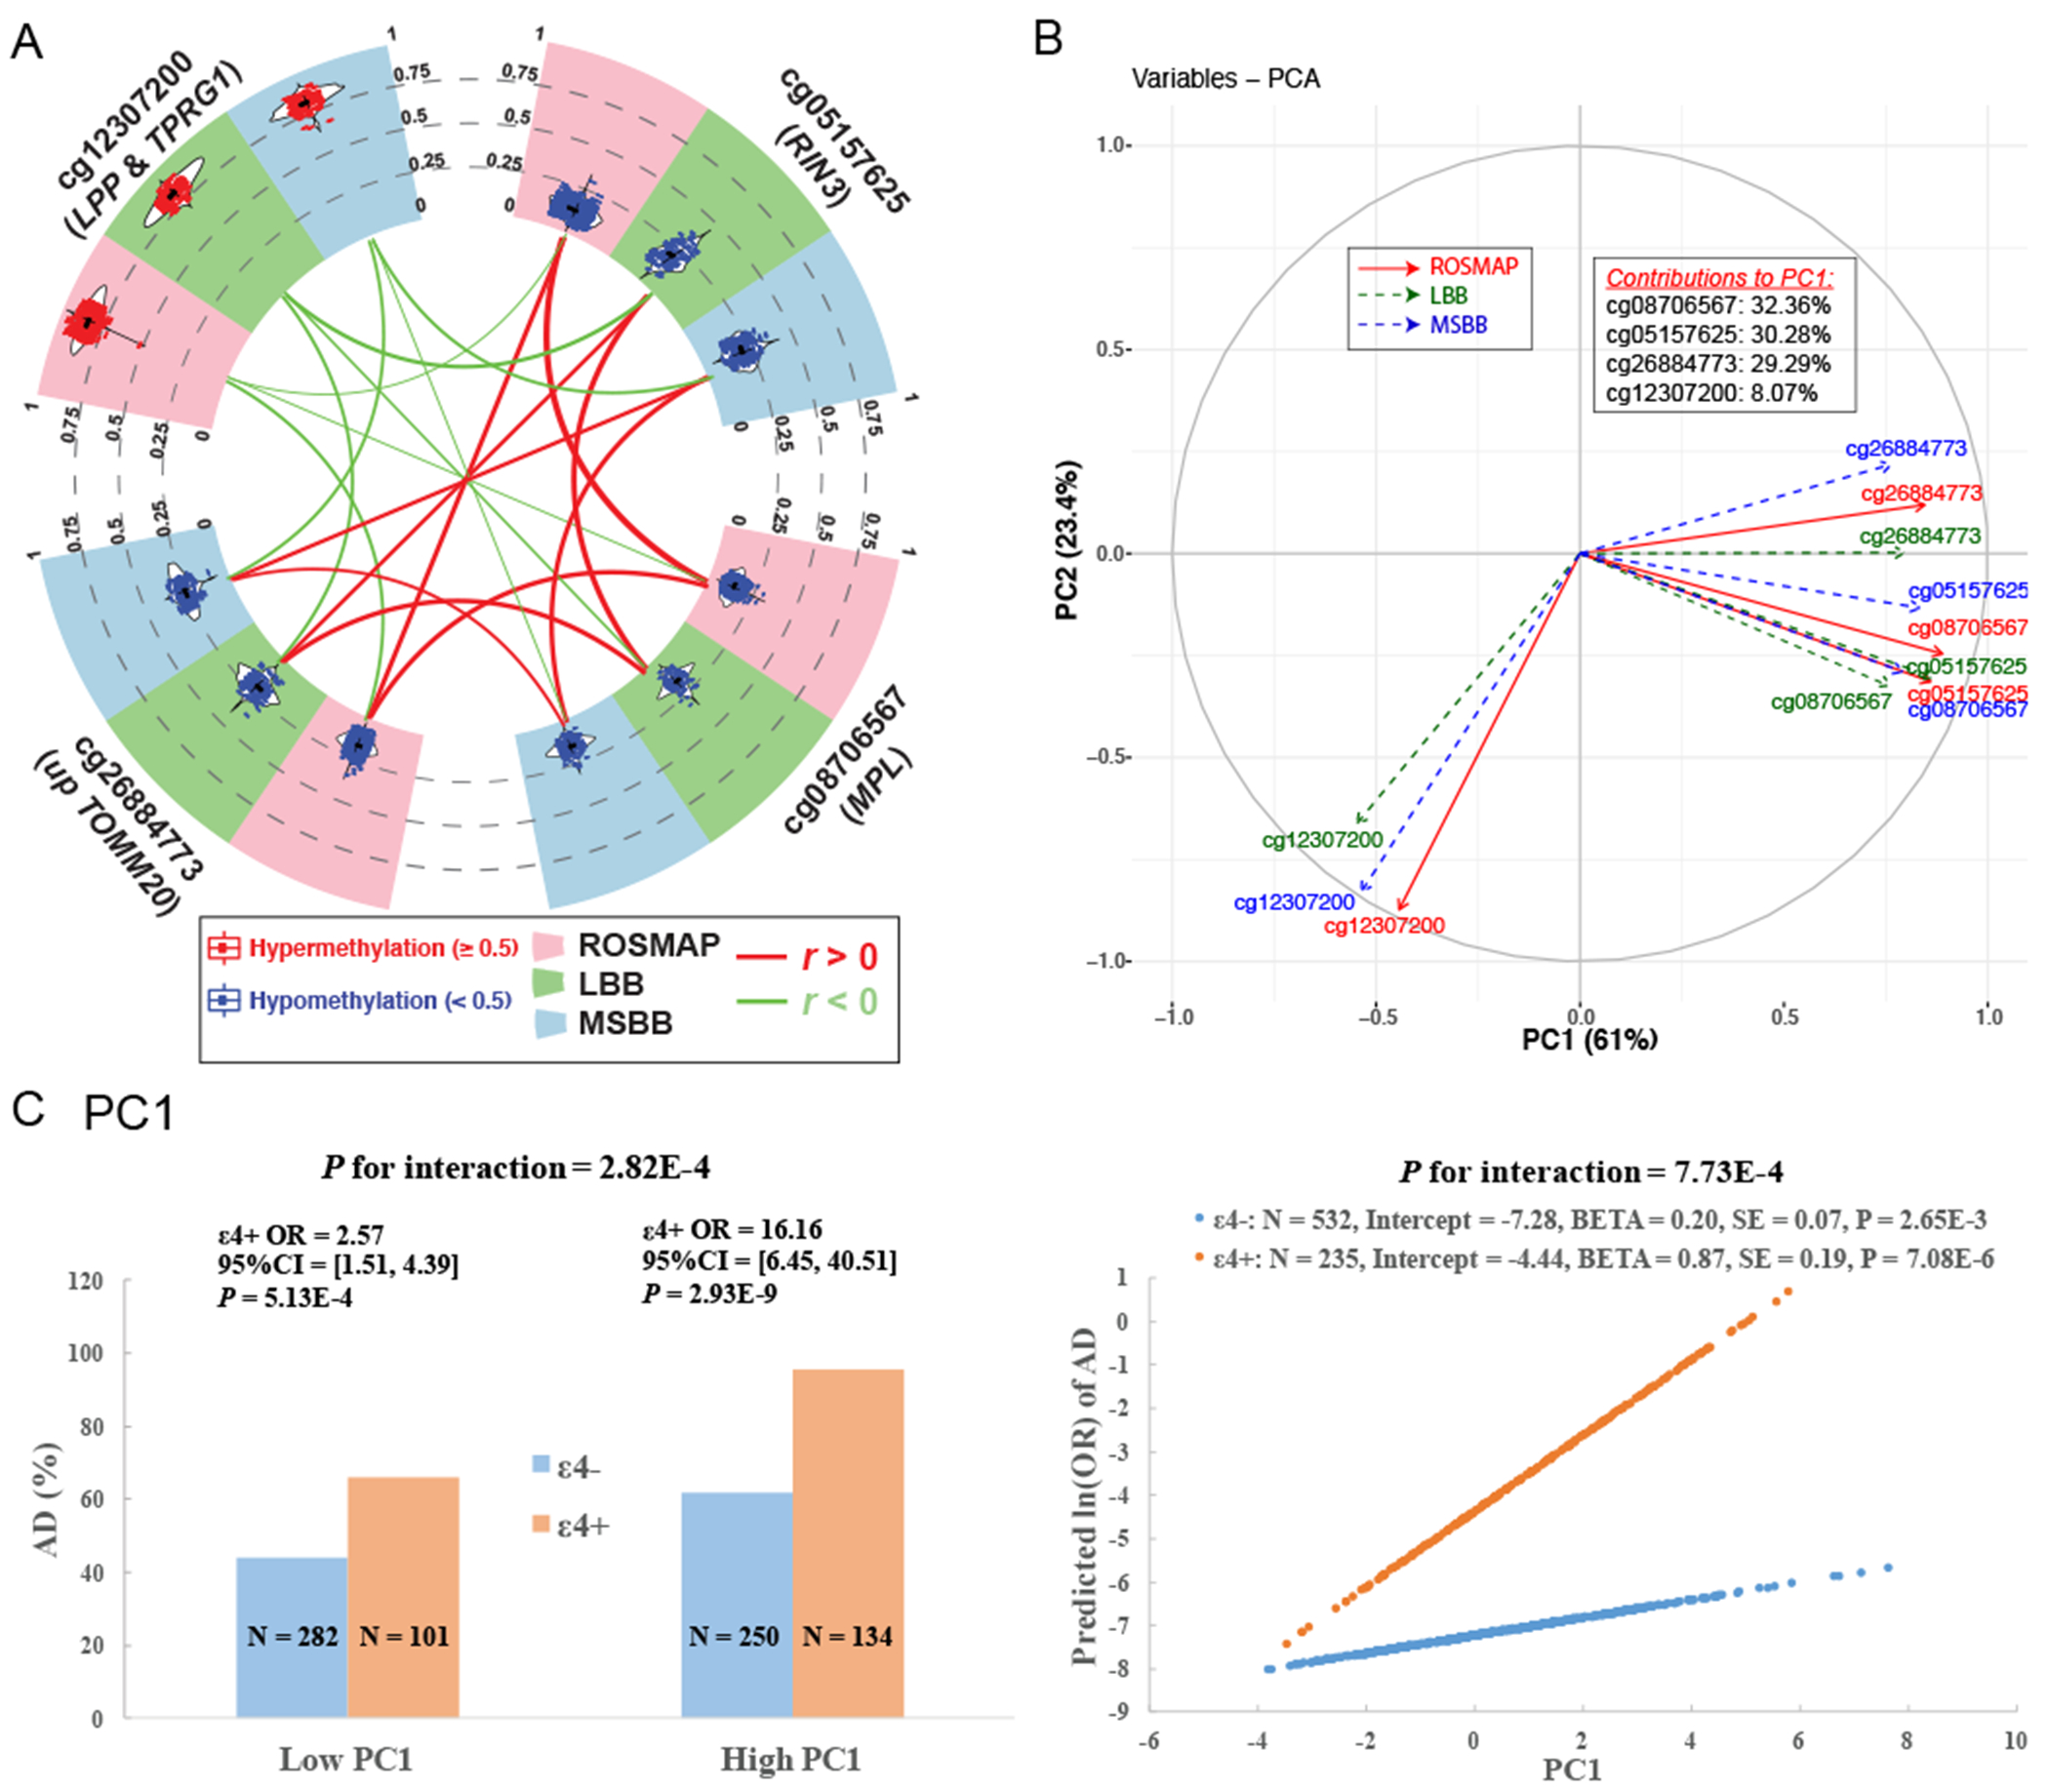
Figure 3. Consistent correlations among the 4 CpG dinucleotides across cohorts and the derivation of the PC1.

(A) Circos plot shows the consistent distributions of each of the top 4 CpG dinucleotides and their mutual correlations across ROSMAP (pink sector), LBB (green sector) and MSBB (blue sector). In the outer layer, the distribution of each CpG dinucleotide within each cohort is shown in a violin plot where each dot represents a subject and the black horizontal and vertical lines denote the mean and standard deviation. Red dots represent those subjects with hypermethylation level (≥0.5) while blue ones represent those subjects with hypomethylation level (<0.5). In the inner layer, the correlations between each pair of 2 CpG dinucleotides within each cohort were represented by their connected lines, where the color denote the direction (red for r>0 and green for r<0) and the thickness denote the strength of their correlations (thicker lines represent stronger correlations). (B) Variance plot of the PC1 vs. PC2 and their contributions to each of the top 4 CpG dinucleotides across ROSMAP (red solid arrow), LBB (blue dashed arrow), and MSBB (blue dashed arrow). (C) Interaction effect on AD between APOE ε4 and PC1. The subgroup of ε4+ and ε4− are represented as blue and orange. Interaction with categorical variables are shown on the left panel where the continuous variable of PC1 were transformed to the binary variable based on the median value. The Y axis represent the percentage of AD cases across 4 subgroups of subjects. The right panel show the interactions with the untransformed continuous PC1. the Y axis represent the predicted ln(OR) of AD calculated based on the statistics within ε4+ and ε4− subgroup using the logistic regression model with binary AD status (case=1 and control=0) as the outcome variable adjusting the covariates of age at death, sex, study, postmortem interval, methylation experimental batches and two major ethnic principles.
Abbreviations: OR, odds ratio.
