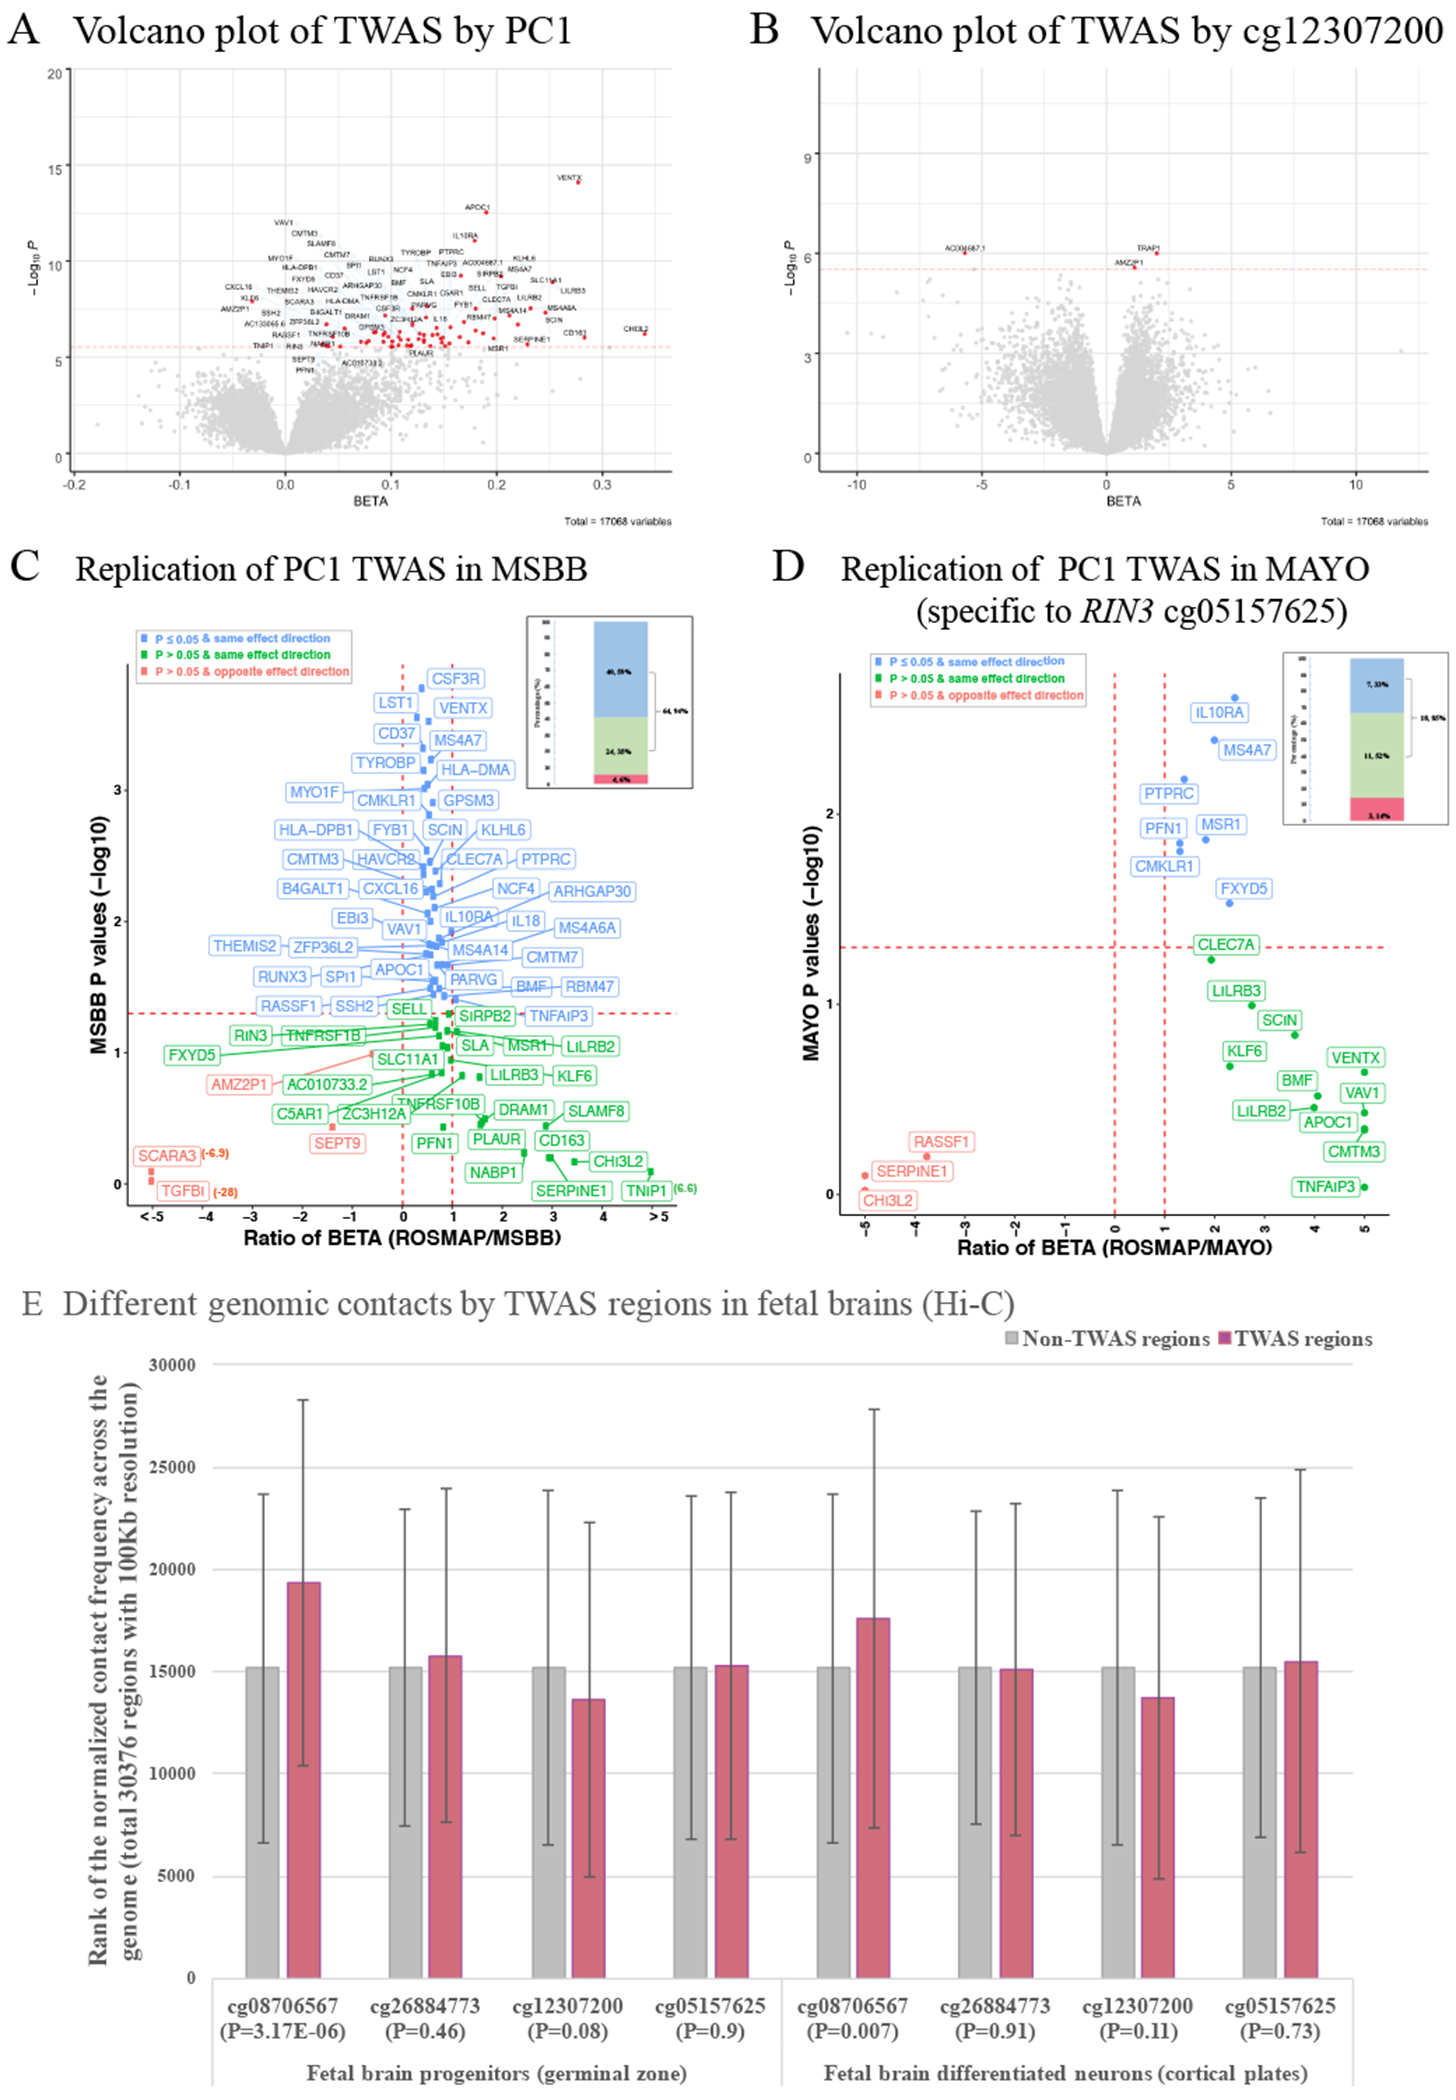
Figure 4. Discovery and replication of TWAS results of the PC1 and cg12307200.

(A) and (B) Volcano plot shows the TWAS results of PC1 and cg12307200. The X axis shows the BETA and the Y axis shows the −log10 transformed P values for the exposure variable of PC1 or cg12307200 on the mRNA expression levels of each gene. The 71 unique genes (70 for PC1 and 3 for cg12307200) passed the Bonferroni corrected significance threshold of P ≤ 2.93x10⁻⁶ (0.05/17,068 autosomal genes) are shown in red dots with their gene name connected through blue arrows. (C) and (D) Replication of the PC1 TWAS results in MSBB and MAYO. ROSMAP has identified 70 TWAS genes for PC1 and 68 of them are available in MSBB. There are 25 (out of 70) genes are significant for cg05157625 (the only CpG dinucleotide available in MAYO) and 21 of them are available in MAYO. The scatter plot shows the comparison of each gene between ROSMAP and MSBB (or MAYO) where the X axis represents the ratio of the regression coefficient obtained in the two cohorts (ROSMAP over MSBB (or MAYO) and the red dashed vertical lines for the ratio=0 or 1) and the Y axis shows the P values in MSBB (or MAYO) (red dashed horizontal line for the P=0.05). The blue dots are those genes with nominal significance (P≤0.05) in MSBB (or MAYO) and with the same effect direction in both ROSMAP and MSBB (or MAYO), the green dots are those non-significant genes (P>0.05) in MSBB (or MAYO) but with the same effect direction, and the red dots are those non-significant genes in MSBB (or MAYO) and also with the opposite effect direction. The number and their percentage of these three groups of genes are presented in the bar plot (upper right corner) with the same color codings. (E) Different genomic contacts by TWAS regions in the fetal brains analyzed with the published Hi-C sequencing data (Won et al., 2016) downloaded from GEO (GSE77565). Silver and rose gold bars represent those regions outside and within the 70 significant TWAS genes in ROSMAP and the P value for the differences between these two groups for each CpG dinucleotide are shown in X axis.
