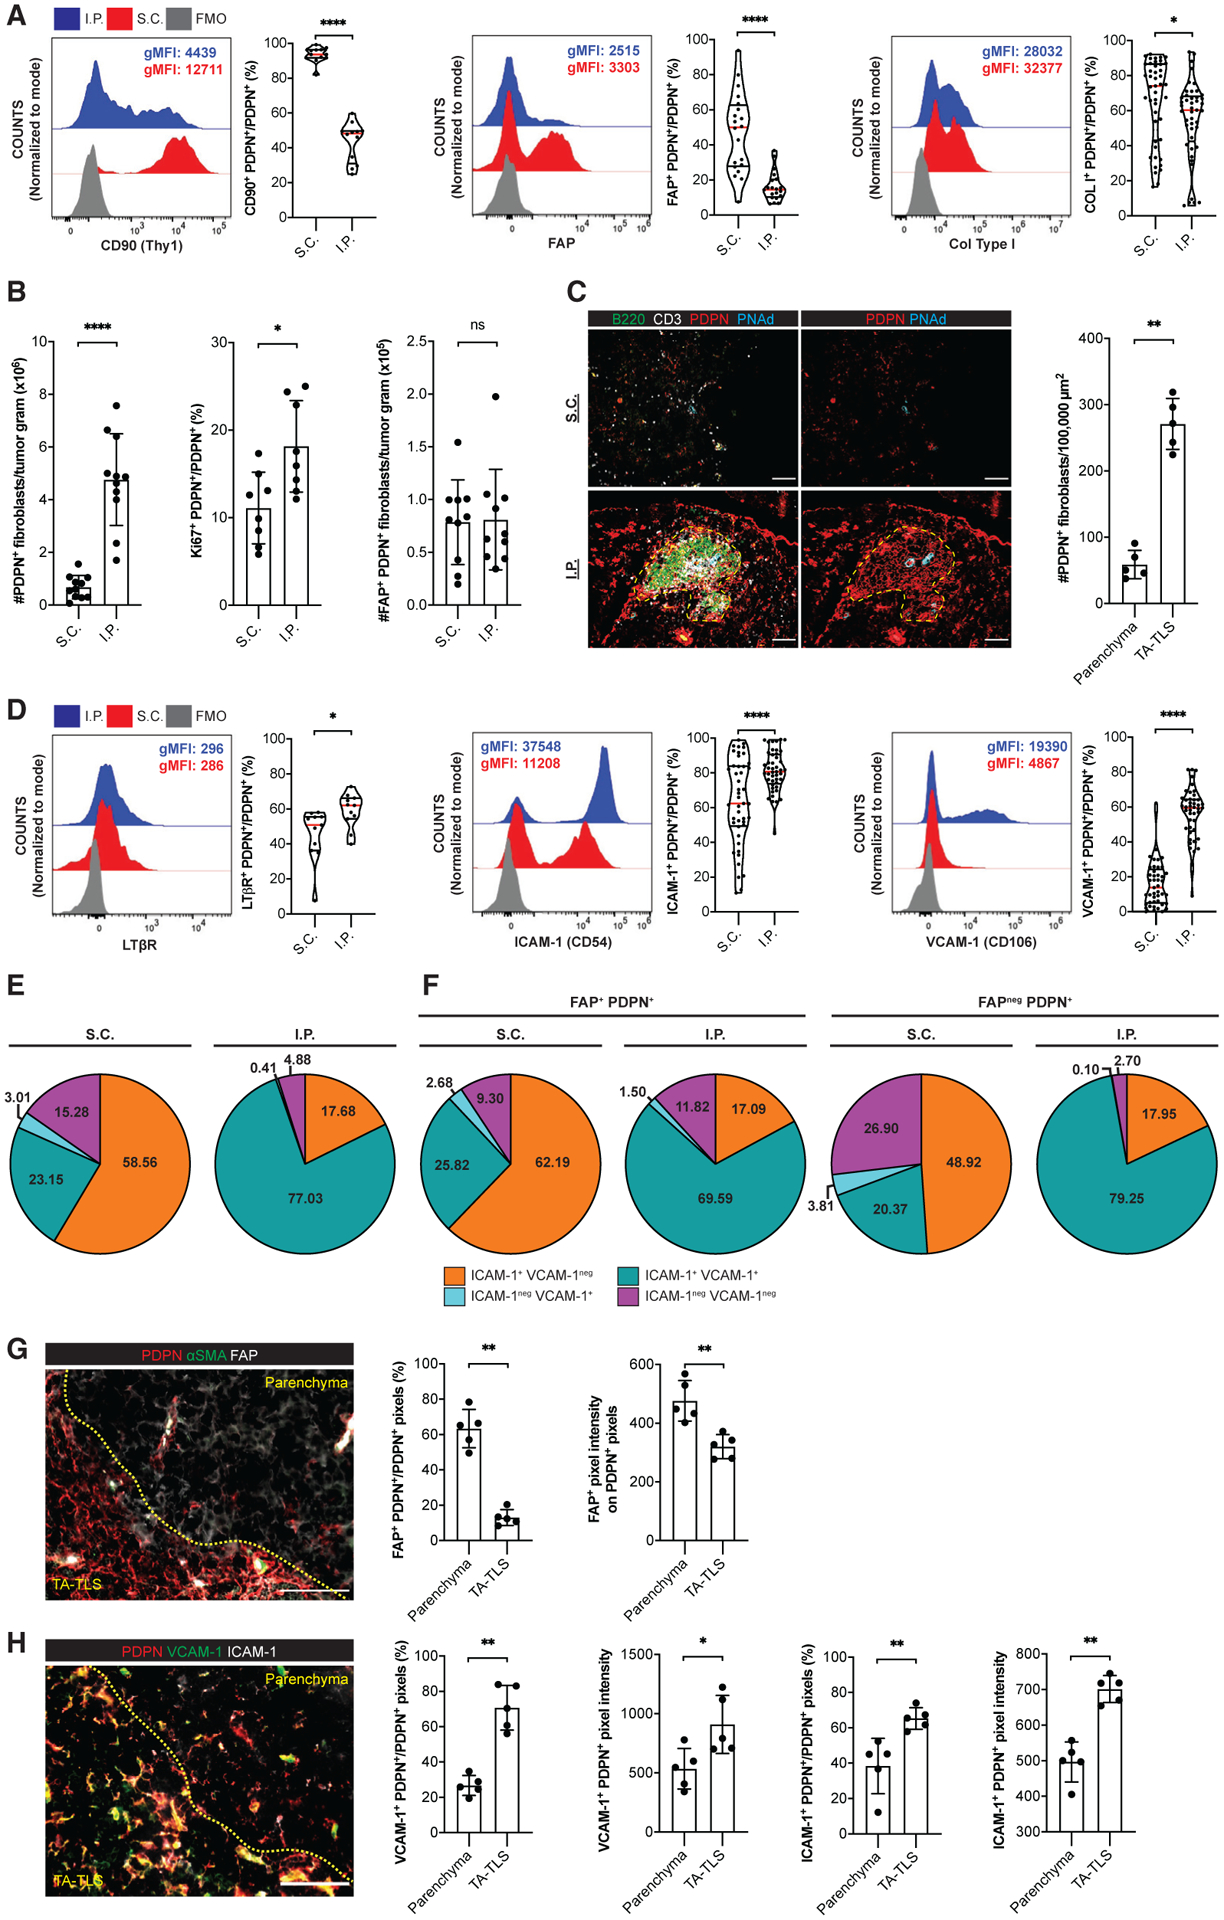
Figure 2. A population of CAF from I.P. tumors exhibit lymphoid tissue organizer cell characteristics.

(A–E, G, and H) Day 14 S.C. or I.P. B16-OVA tumors from WT mice were prepared for flow cytometry (A, B, D, and E) or IF (C, G, and H) as described in STAR Methods. (A and D) Left, representative histograms and geometric mean fluorescence intensities (gMFIs) of indicated markers on PDPNhi CD31neg CD45neg Ter119neg CAF. gMFIs calculated on cells gated above the fluorescence minus one (FMO) control. Right, percentage of CAF expressing indicated markers. Data are from two to five experiments; n = 11–45 tumors per group.
(B, E, and F) CAF subpopulations were quantitated by flow cytometry. Data are from two to three experiments; n = 8–11 tumors per group.
(C, G, and H) Left, representative images of tumors stained with indicated markers. Yellow dashes delimit TA-TLS area. Scale bar: 100 μm. Right, summary data of PDPN+ CAF densities (C) and marker expression in parenchymal and TA-TLS regions (G and H) from one experiment; n = 5 tumors per group. Pixel intensities were calculated using a PDPN mask.
Results are mean ± SD analyzed by unpaired Welch’s t test. nsp > 0.05, **p < 0.01, ***p < 0.001, ****p < 0.0001.
