
Figure 3. CAF act as surrogate lymphoid tissue organizer cells that orchestrate TA-TLS formation.
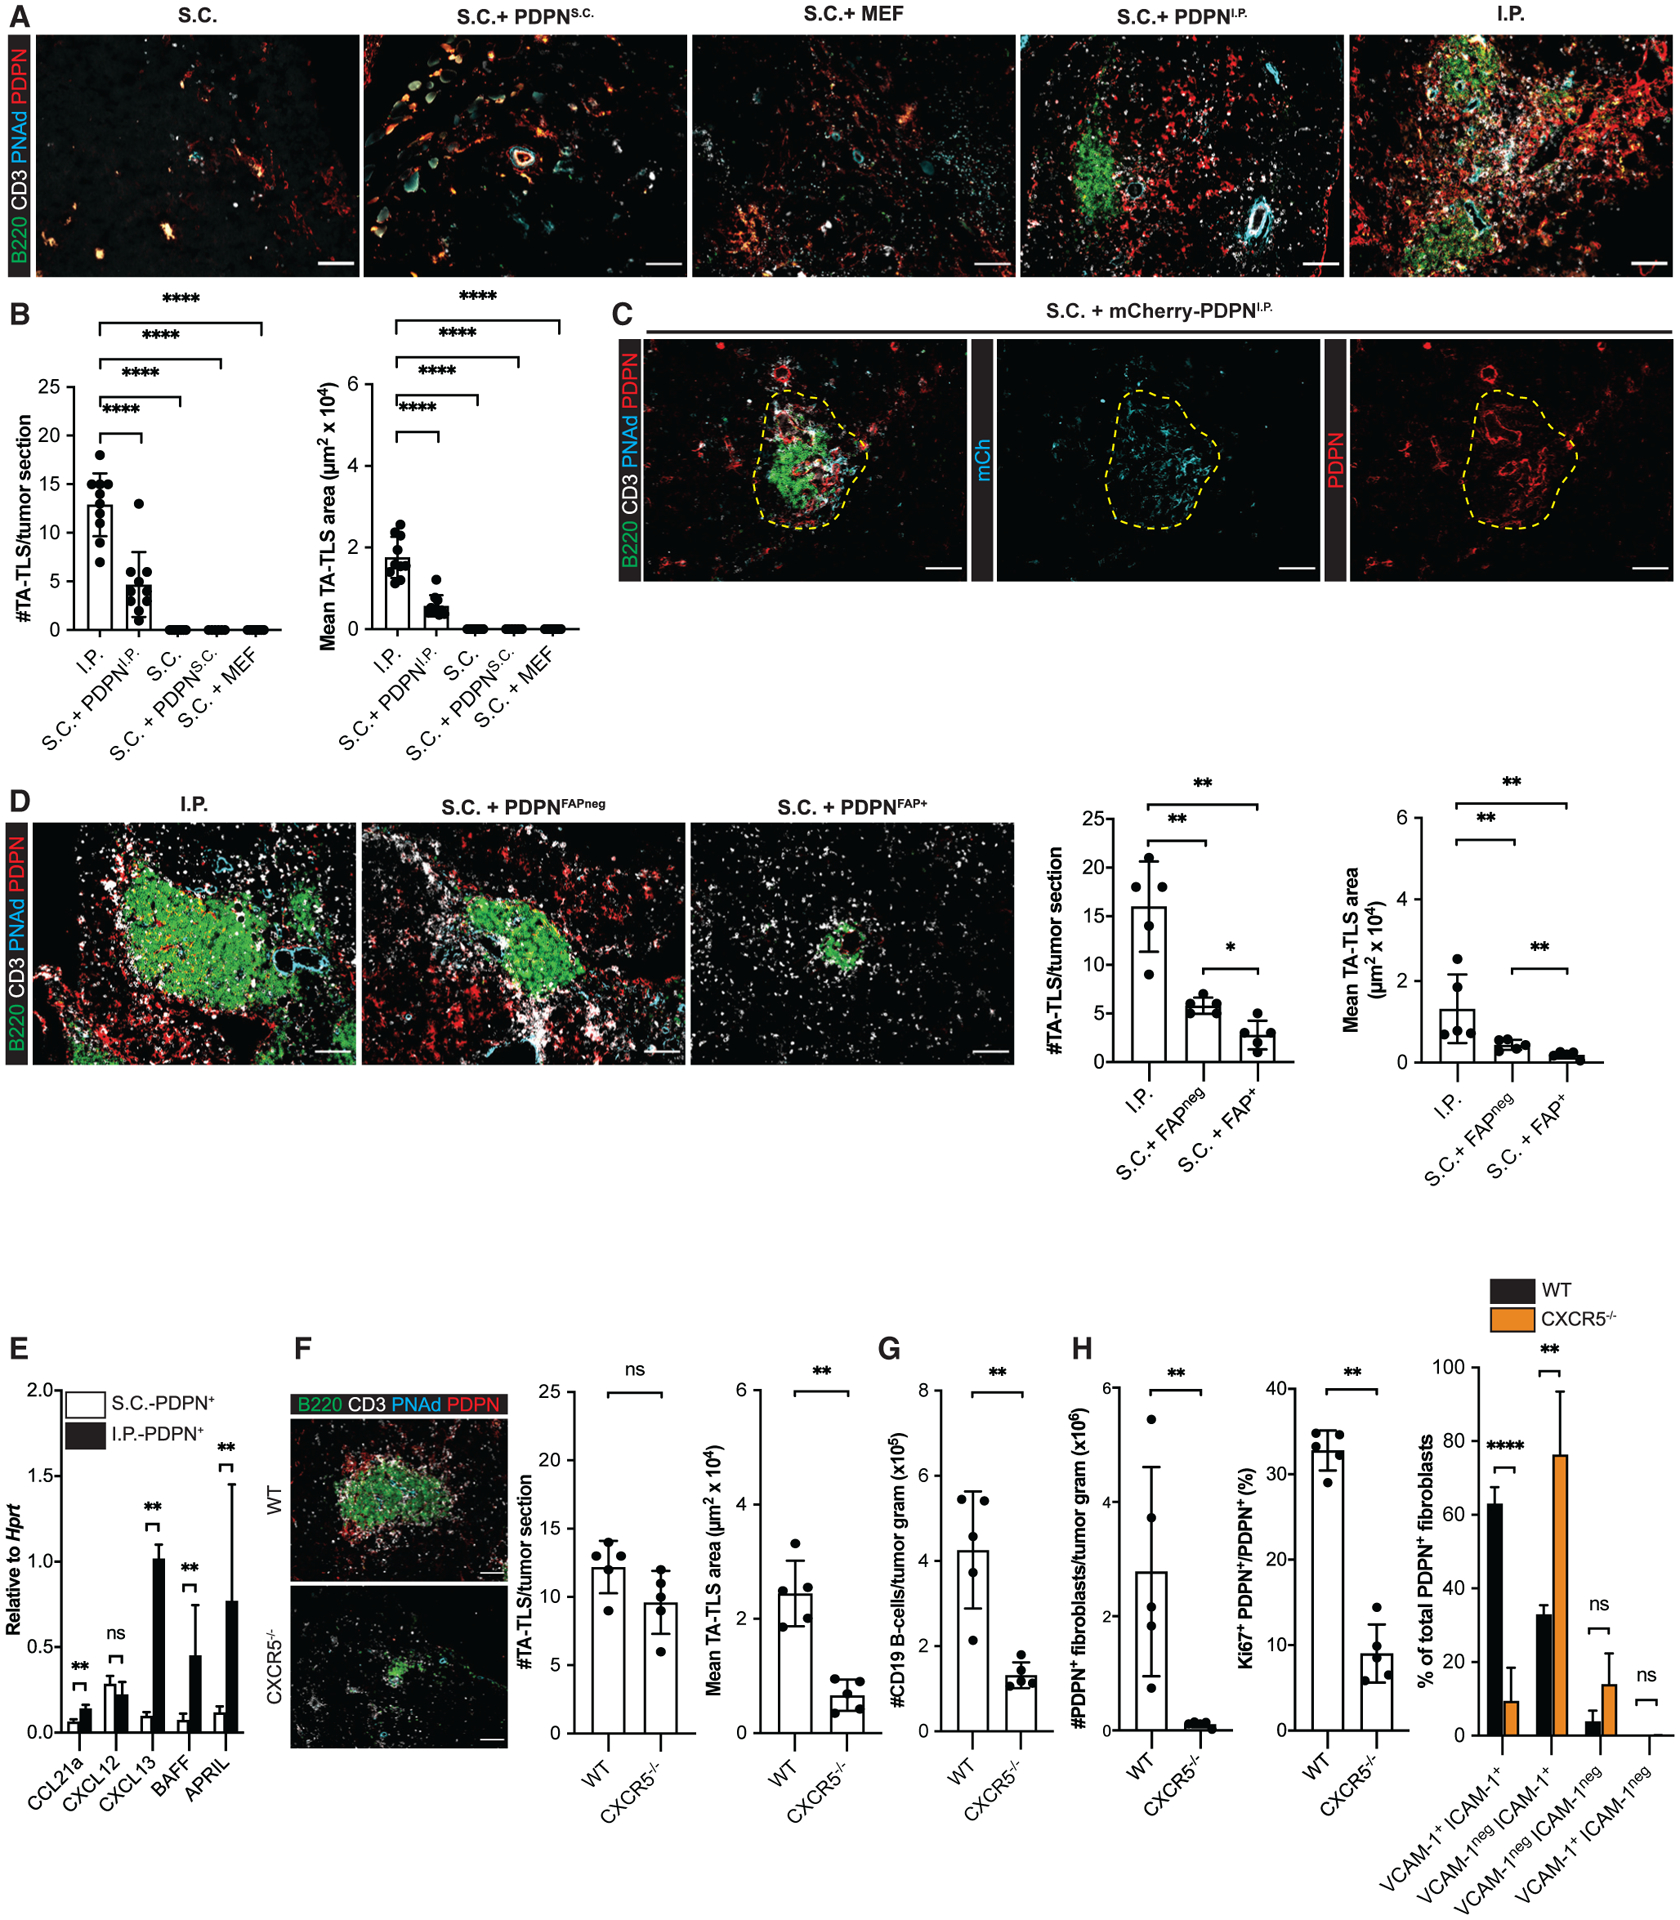
(A–D) S.C. tumors were induced by co-injection of B16-OVA cells together with the indicated populations of fibroblasts. Day 14 S.C. or I.P. tumors were prepared for IF as described in STAR Methods. (A, C, and D, left) Representative images. Yellow dashed region (C) represents TA-TLS area. Scale bar: 100 μm. (B and D, right) Summary data from one to two experiments; n = 5 or 10 tumors per group.
(E) CAF from day 14 S.C. and I.P. tumors were purified, and expression of the indicated RNA transcripts was determined as described in STAR Methods. Data from two experiments presented as 2−ΔCT relative to Hprt; n = 6 tumors per group.
(F–H) Day 14 I.P. tumors from WT or CXCR5−/− mice were prepared for IF (F) or flow cytometry (G and H) as described in STAR Methods. (F) Left: representative images. Scale bar: 100 μm. Right: summary data from one experiment; n = 5 tumors per group. (G and H) Cell populations were quantitated as outlined in Figures 1 and 2. Data represent one experiment; n = 5 tumors per group.
Results are mean ± SD, analyzed using Kruskal-Wallis H test with Dunn’s post-test (B and D) or unpaired Welch’s t test (E–H). nsp > 0.05, *p < 0.05, **p < 0.01, ****p < 0.0001.