
Figure 5. Induction and robust development of PDPN+ reticular networks in TA-TLS are regulated by TNFR and LTbR signaling, respectively.
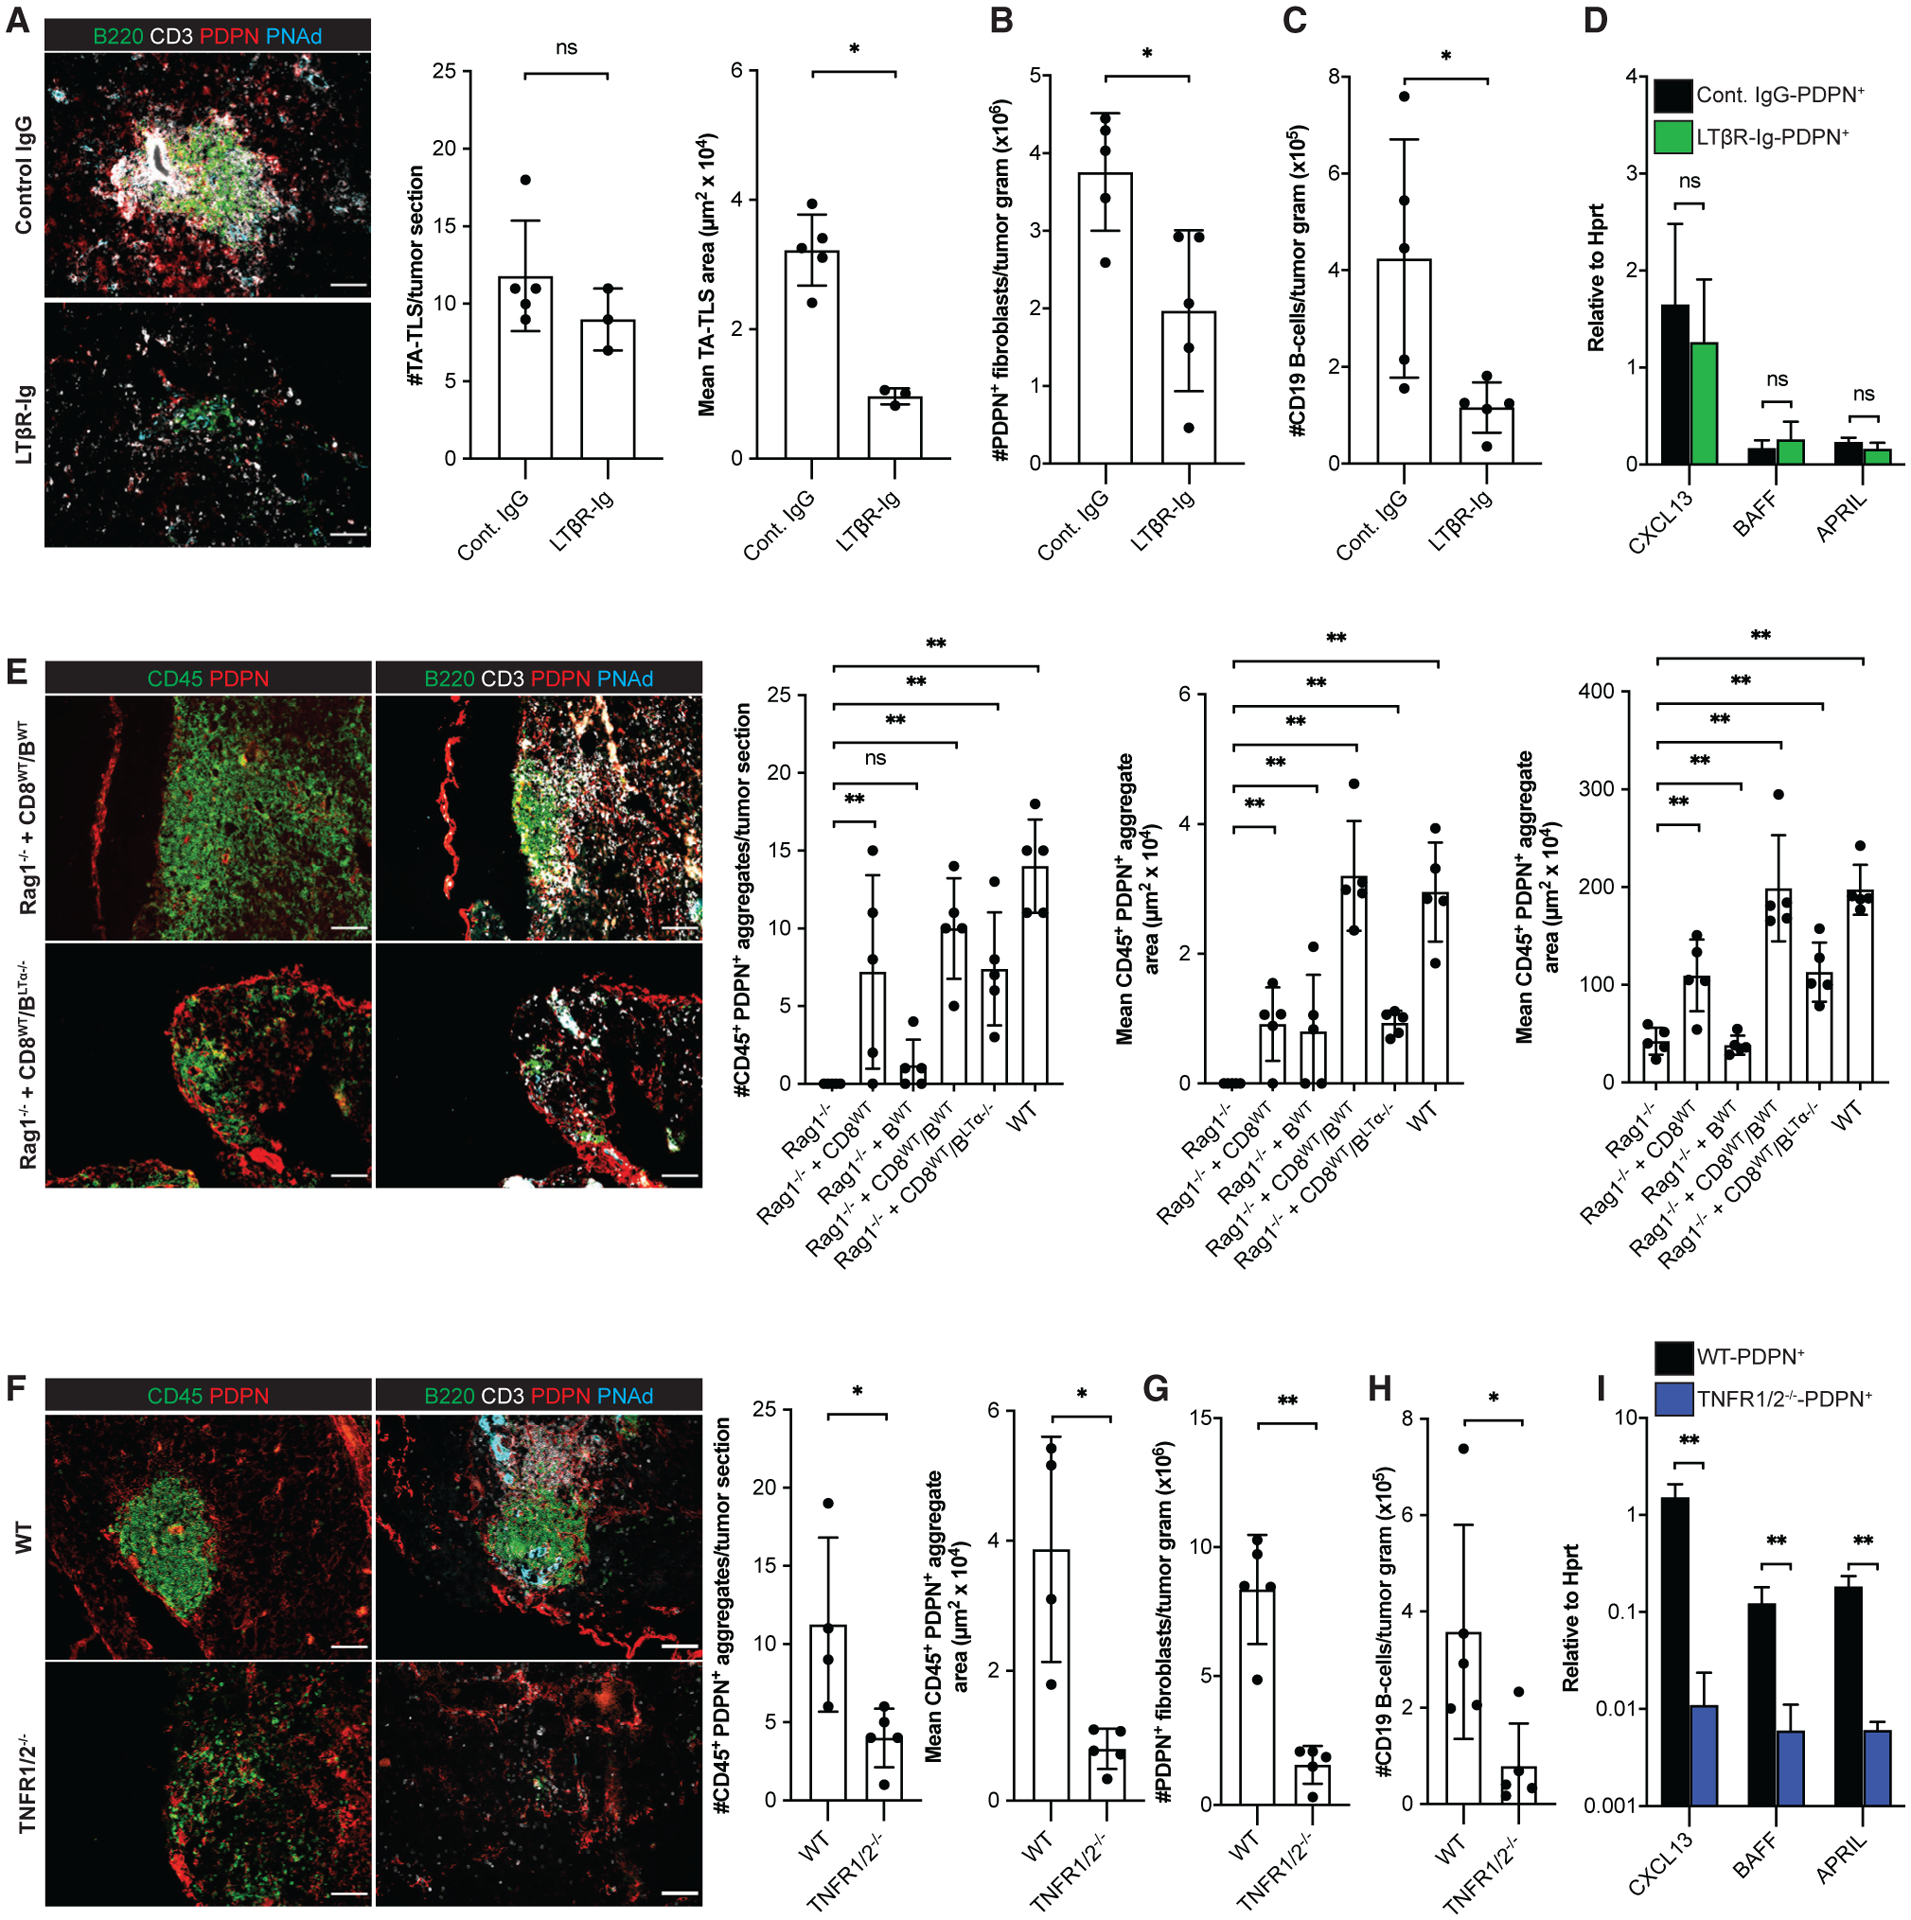
Day 14 I.P. B16-OVA tumors from WT mice, WT mice treated with LTβR-Ig fusion protein, TNFR1/2−/− mice, Rag1−/− mice, and Rag1−/− mice repleted with CD8 T cells and/or B cells 3 days prior to tumor implantation were analyzed by IF or flow cytometry as described in STAR Methods. (A, E, and F) Scale bars: 100 μm. Data are from one experiment; n = 3–5 tumors per group.
(B, C, G, and H) Data are from one experiment; n = 5 tumors per group.
(D and I) CAF from day 14 i.p. tumors from WT mice, WT mice treated with LTβR-Ig, or TNFR1/2−/− mice were purified and expression of the indicated RNA transcripts determined as described in STAR Methods. Data are from two experiments presented as 2−ΔCT relative to Hprt; n = 6 tumors per group.
Results are mean ± SD analyzed using unpaired Welch’s t test (A–D and F–I) or Kruskal-Wallis H test with Dunn’s post-test (E). nsp > 0.05, *p < 0.05, **p < 0.01.