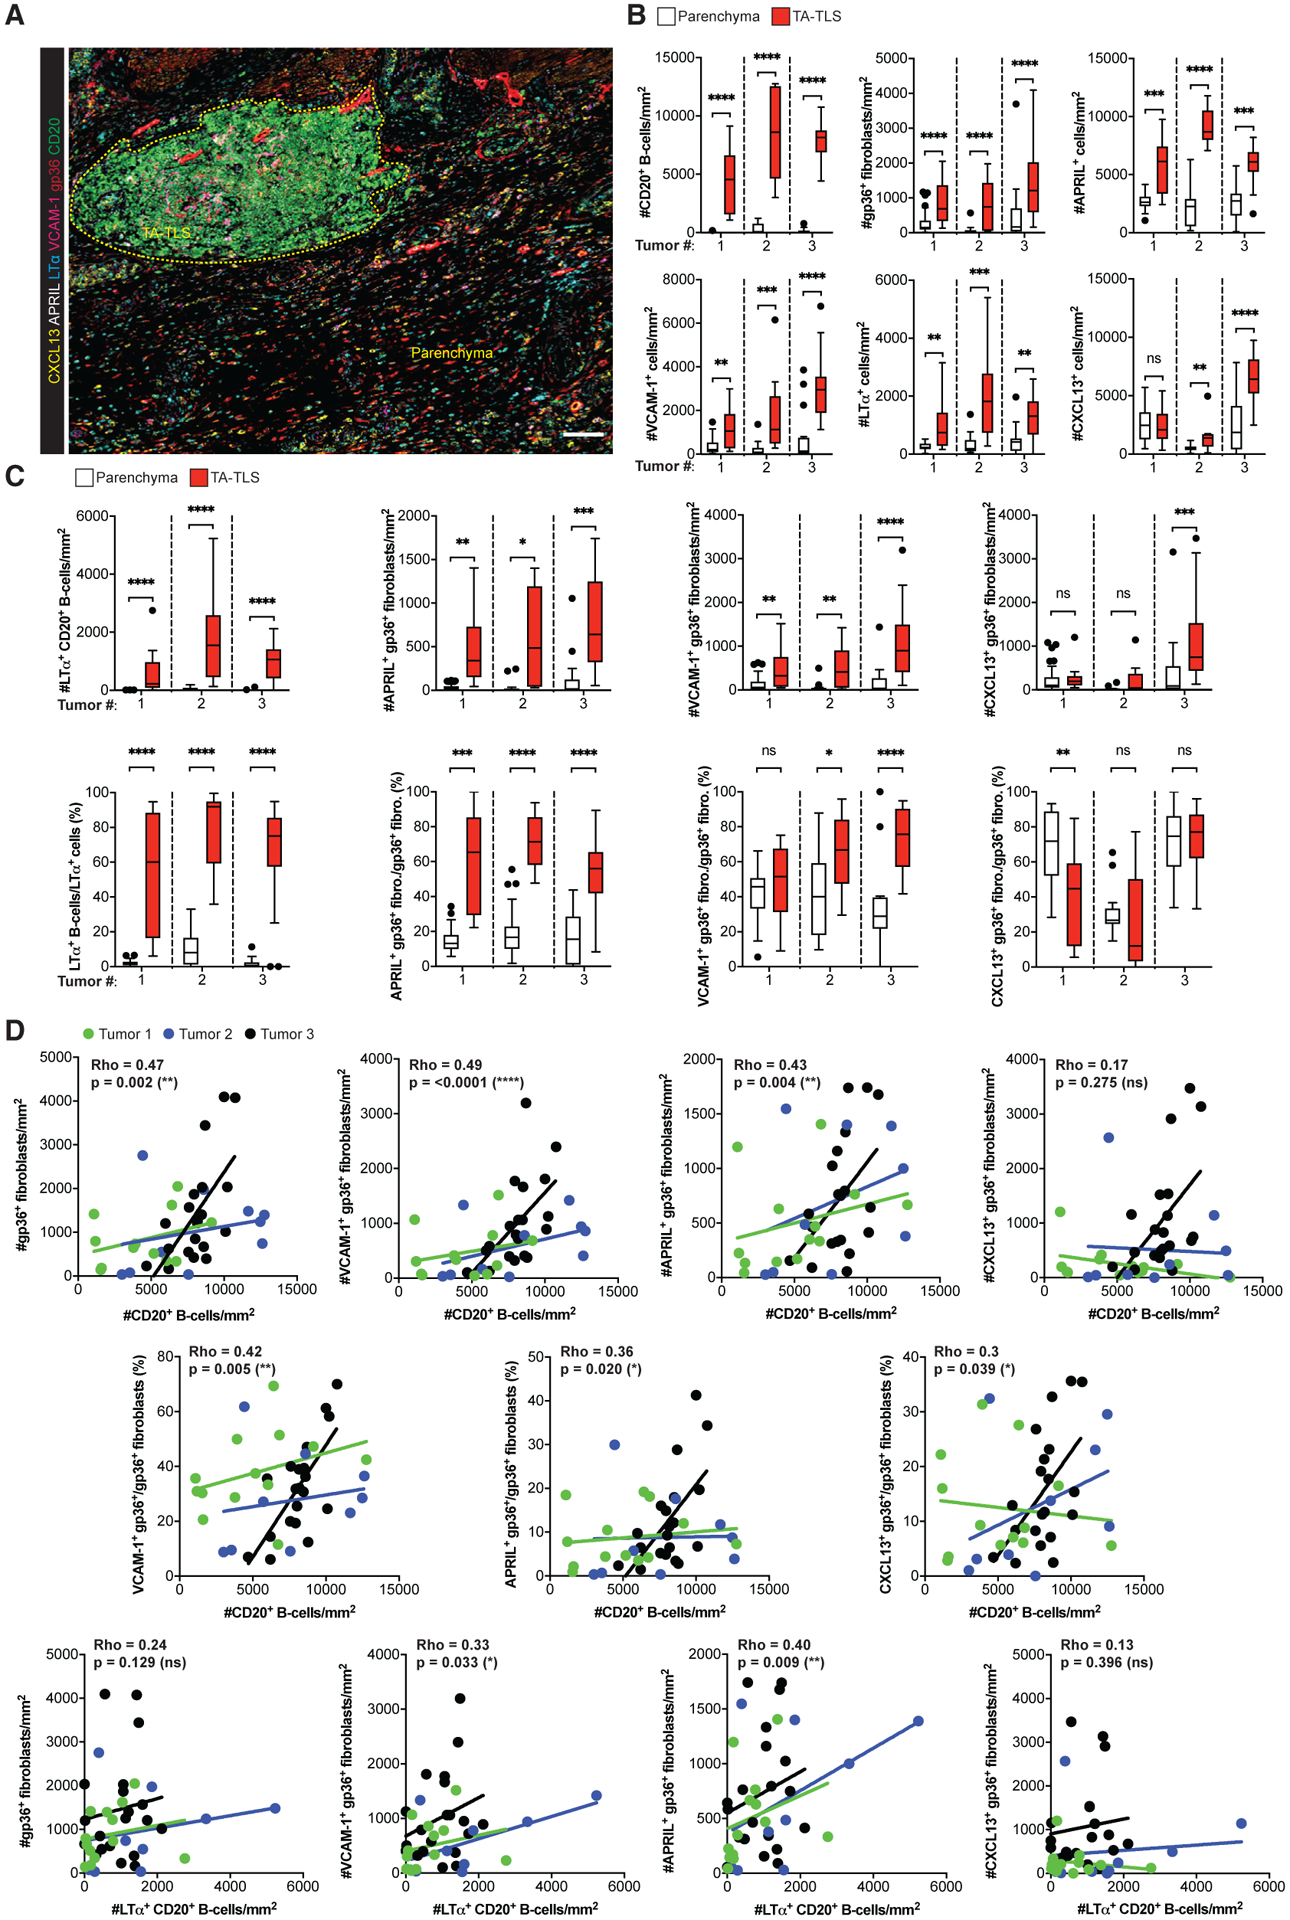
Figure 6. Human TA-TLS are associated with LT+ B cells and a co-extensive reticular network of CAF with lymphoid tissue organizer characteristics.

Human melanoma biopsies containing TA-TLS were collected, prepared, stained, and analyzed as described in STAR Methods.
(A) Representative image of a TA-TLS-containing melanoma sample. Dashed yellow line represents TA-TLS area. Scale bar: 100 μm.
(B and C) Densities and percentages of single- (B) and dual-stained (C) cell populations in parenchyma and TA-TLS regions of tumors from three patients (n = 12–39 parenchyma and TA-TLS regions of interest). Data were analyzed by Wilcoxon rank-sum test, and boxplots were generated according to Tukey’s method.
(D) Correlations between density of B cell populations and density or fraction of fibroblast populations. Dots represent individual TA-TLS. Each line represents the correlation for an individual tumor. Rho represents the multilevel correlation coefficient for the three tumors. Spearman’s linear mixed-models multilevel correlation analysis was determined for all tumors together to account for the nested data structure. nsp > 0.05, *p < 0.05, **p < 0.01, ***p < 0.001, ****p < 0.0001.
