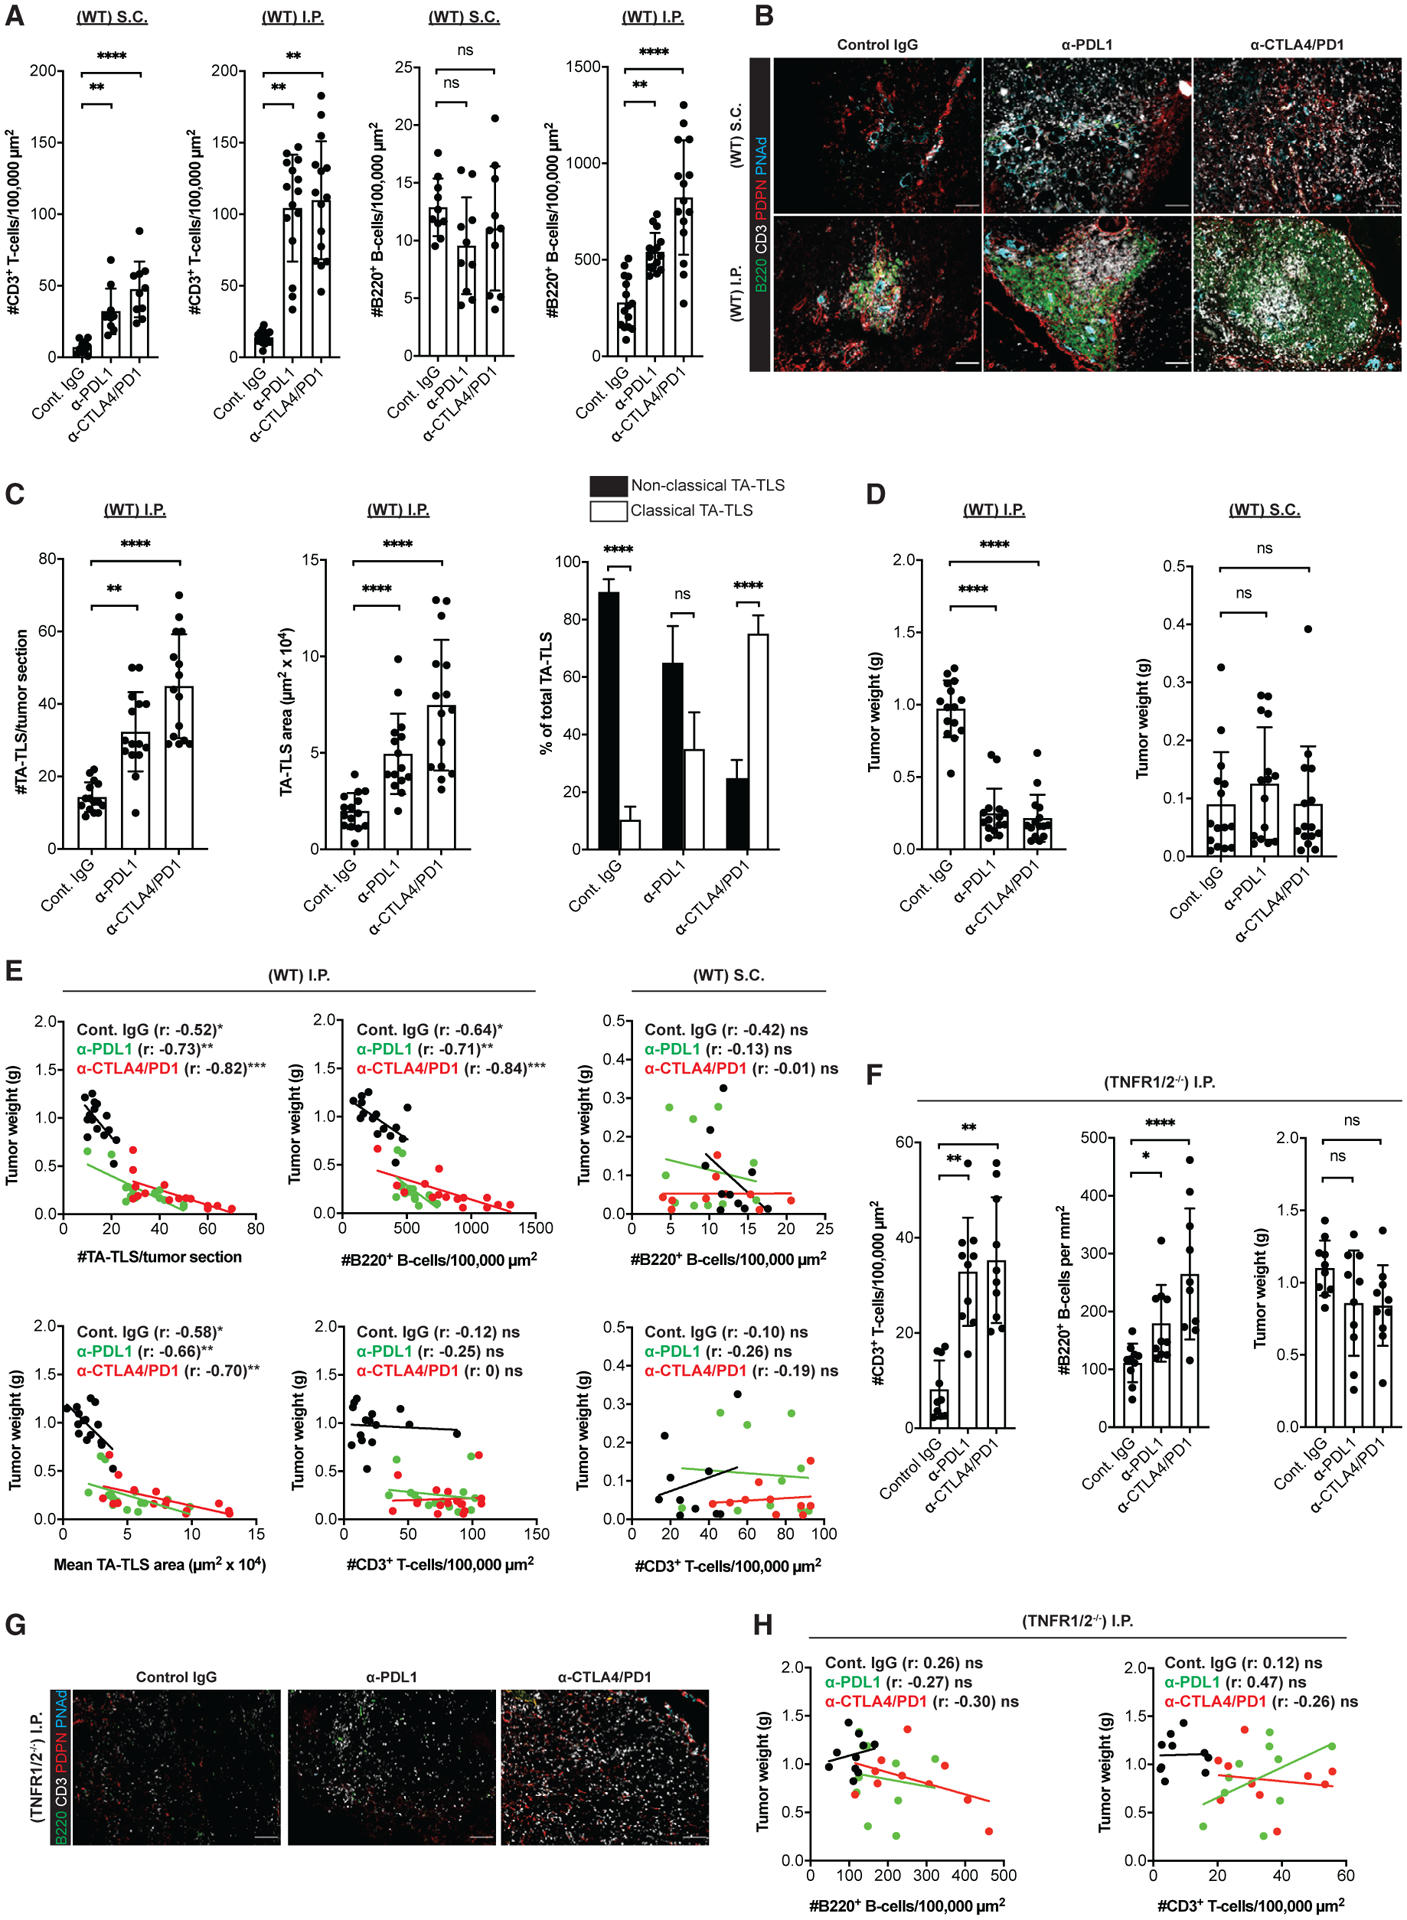
Figure 7. TA-TLS number, size, and organization are augmented by checkpoint immunotherapy and correlated with tumor control.

WT or TNFR1/2−/− mice were treated with control IgG, anti-PDL1, or anti-CTLA4/PD1 beginning 3 days after S.C. or I.P. tumor implantation. Tumors were harvested on day 14, weighed, and prepared for IF.
(A) Summary data for intratumoral parenchymal (non-TA-TLS) T and B cell densities in WT mouse tumors.
(B) Representative images showing typical TA-TLS size and organization in tumors from WT mice treated as indicated. Scale bar: 100 μm.
(C) Summary data of TA-TLS characteristics in tumors from WT mice. Classical TA-TLS are distinguished from non-classical by the presence of distinct T and B cell compartments.
(D) Tumor weights determined at harvest on day 14.
(E) Spearman correlation analysis of WT mouse tumor weights with TA-TLS number, size, or densities of intratumoral parenchymal T and B cells. Each dot represents an individual tumor.
(F) Left and middle: summary data for intratumoral parenchymal (non-TA-TLS) T and B cell densities in TNFR1/2−/− mouse tumors. Right: tumor weights were determined at harvest on day 14.
(G) Representative intratumoral images of i.p. tumors from TNFR1/2−/− mice treated as indicated. Scale bars: 100 μm.
(H) Spearman correlation analysis of TNFR1/2−/− mouse tumor weights with densities of T and B cells. Each dot represents an individual tumor.
(A–E) Data are from two to three experiments; n = 10–15 tumors per group. (F–H) Data are from two experiments; n = 10 tumors per group. Results shown as mean ± SD analyzed using Kruskal-Wallis H test with Dunn’s post-test (A, C, D, and F) or Spearman’s multilevel correlation analysis (E and H). nsp > 0.05, *p < 0.05, **p < 0.01.
