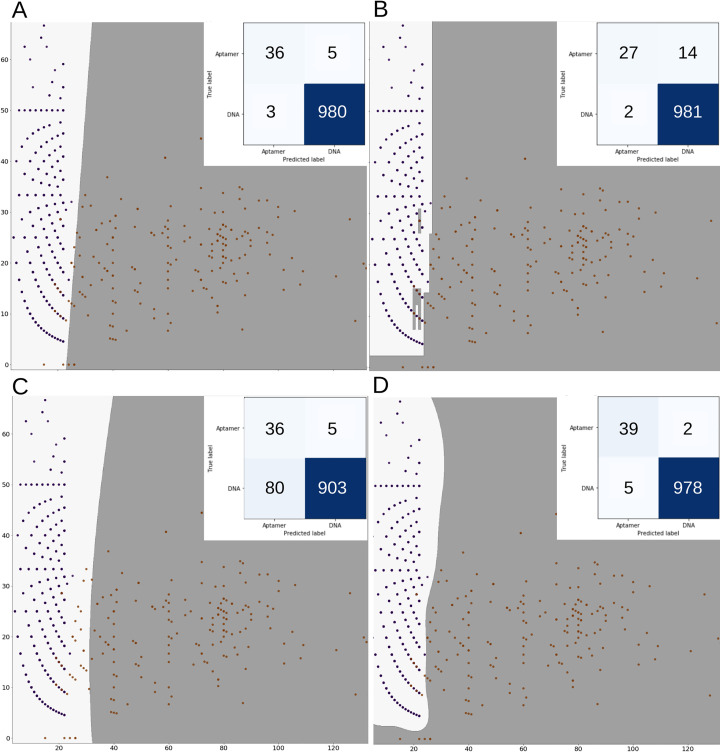
Fig 6. Scatter plots of each ML model.
DNA aptamer sequences are shown as orange dots and DNA sequences are shown as dark blue dots. The insert shows the confusion matrix of each model. (A) Logistic Regression, (B) Decision Tree Classifier, (C) Gaussian Naïve Bayes and (D) Support Vector Machines. The light gray area is the boundary for predicted DNA sequences and the dark gray area is the boundary for predicted DNA aptamer sequences.

