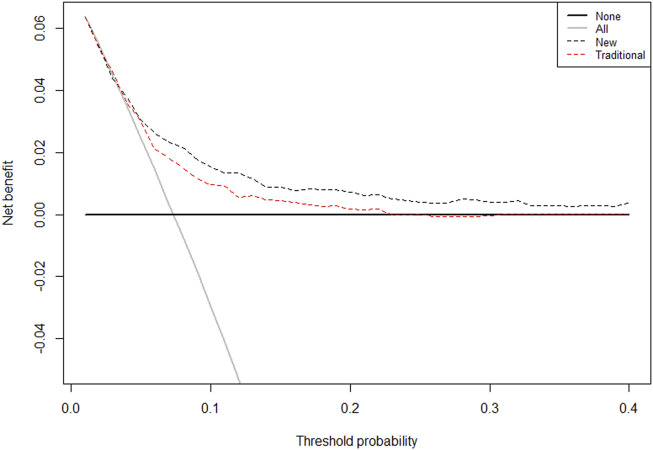
FIGURE 7.
The Decision Curves Analysis (DCA) curve of the prognostic nomogram for predicting probability of overall survival at 5 years. Note: The traditional group-composed by parameters of age, sex, hypertension, diabetes, CHOL, HDLC, BMI, smoking, TRIG; Novel group: age, HF, FT3/FT4, ALB, and proBNP. The horizontal axis represents the threshold value, which is the reference probability of whether a patient receives treatment, and the vertical axis represents the net benefit rate after the advantages minus the disadvantages. Under the same threshold probability, the larger net benefit implies that patients can obtain the maximum benefit using the diagnosis of this model. The closer the curve in the DCA graph is to the top, the higher the value of the model diagnosis will be.

