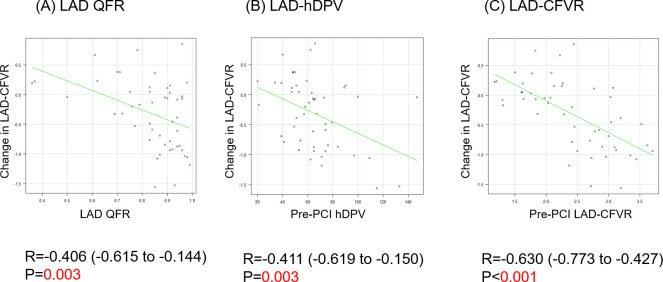
Fig 3. Correlation analyses between LAD angiographic and functional stenosis severity, and the change in LAD-CFVR.
LAD-QFR values were correlated with the changes in LAD-CFVR (post-PCI CFVR–pre-PCI CFVR, A). Additionally, pre-PCI LAD-hDPV and pre-PCI LAD-CFVR were correlated with changes in LAD-CFVR (B and C). QFR: Quantitative flow ratio. Other abbreviations as in Fig 1.

