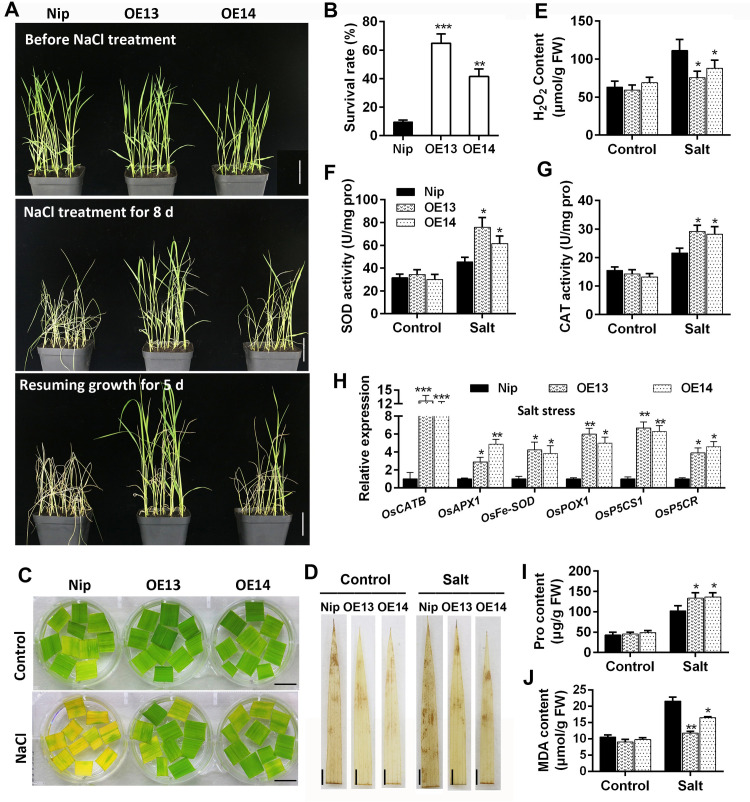
Fig 3. Phenotypes of OsMADS23-overexpressing lines under salt stress.
(A) Images showing the phenotypes of wild type (Nip) and OsMADS23-overexpressing lines (OE13 and OE14) under salt stress. Twenty-eight-day-old plants were subjected to 300 mM salt stress and then resumed growth. Scale bars, 5 cm. (B) The survival rates of wild type and overexpression lines after 8 days of salt stress and then 5 days of resuming growth. Error bars indicate SD with biological triplicates (n = 3, each replicate containing 48 plants). (C) The leaves detached from 60-day-old plants were exposed to 200 mM NaCl for 3 days to indicate the salt stress tolerance. Scale bars, 2 cm. (D) DAB staining for the leaves of plants exposed to salt stress for 5 days to indicate H2O2 levels. Scale bars, 1.5 cm. (E) Quantification of H2O2 content in the leaves from plants exposed to salt stress for 5 days. (F) and (G) Activities of SOD and CAT in plants exposed to salt stress for 5 days, respectively. (H) Expression of ROS-scavenging genes in plants exposed to salt stress for 3 days. (I) and (J) Content of proline and MDA in plants exposed to salt stress for 5 days, respectively. In (E) to (J), error bars indicate SD with biological triplicates (n = 3, each replicate containing 3 plants). *p < 0.05, **p < 0.01 or ***p < 0.001 (Student’s t test). All data are means ± SD. Three independent experiments were performed.

