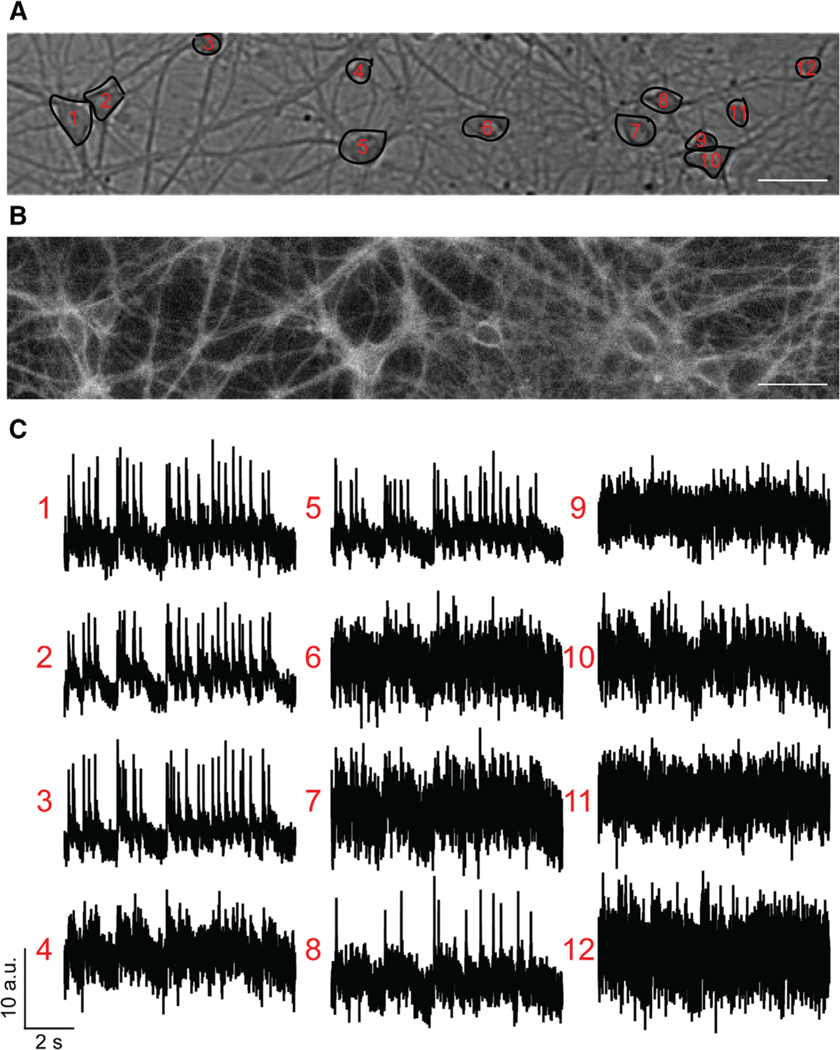
Figure 4.
Voltage imaging with BeRST 1. (A) Example brightfield image with selected regions of interest (ROIs). (B) Example fluorescence image from the same field of view (FOV). (C) Raw fluorescence traces from the selected ROIs. These traces will be analyzed by SpikeConnect in Basic Protocol 3. Scale bar, 10 μm.

