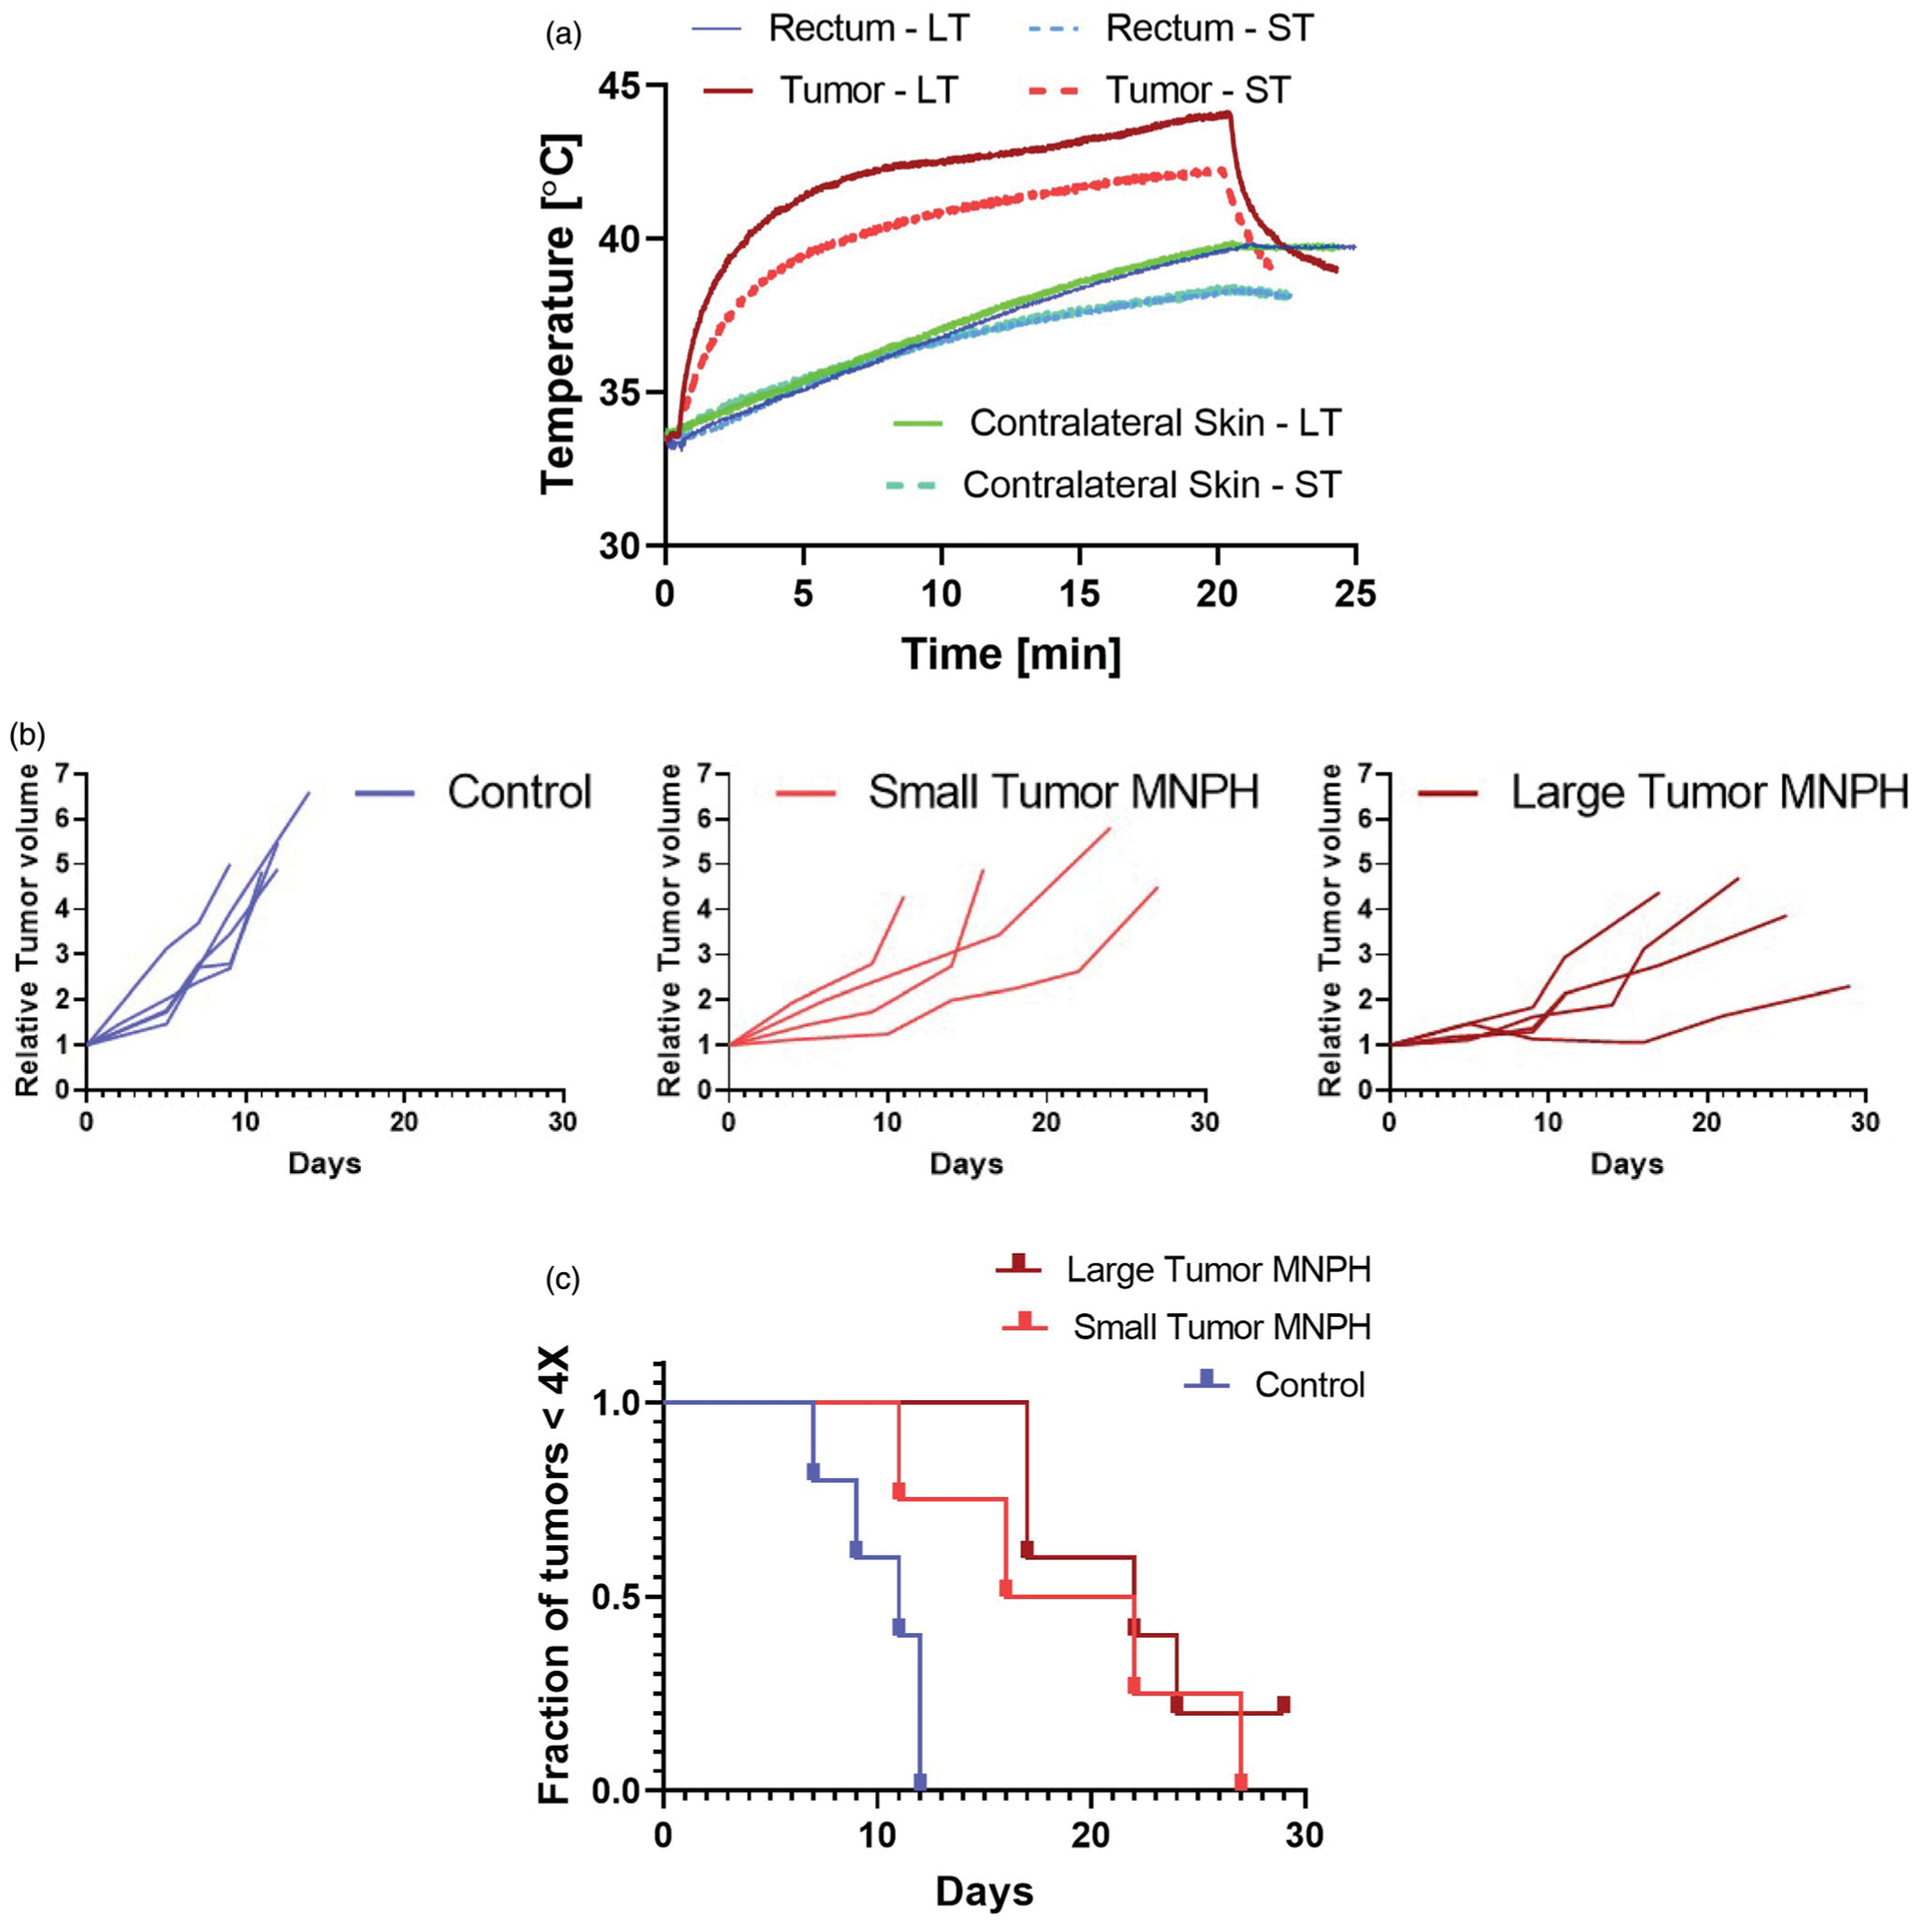
Figure 3.

(a) An example of temporal temperature rise for small and large tumors during a MNPH treatment in MiaPaCa02 mice model. (b) Relative tumor growth curves for induvial mice. (c) Kaplan–Meier plot showing the outcome of MNPH treatment for untreated control, small and large tumors.
