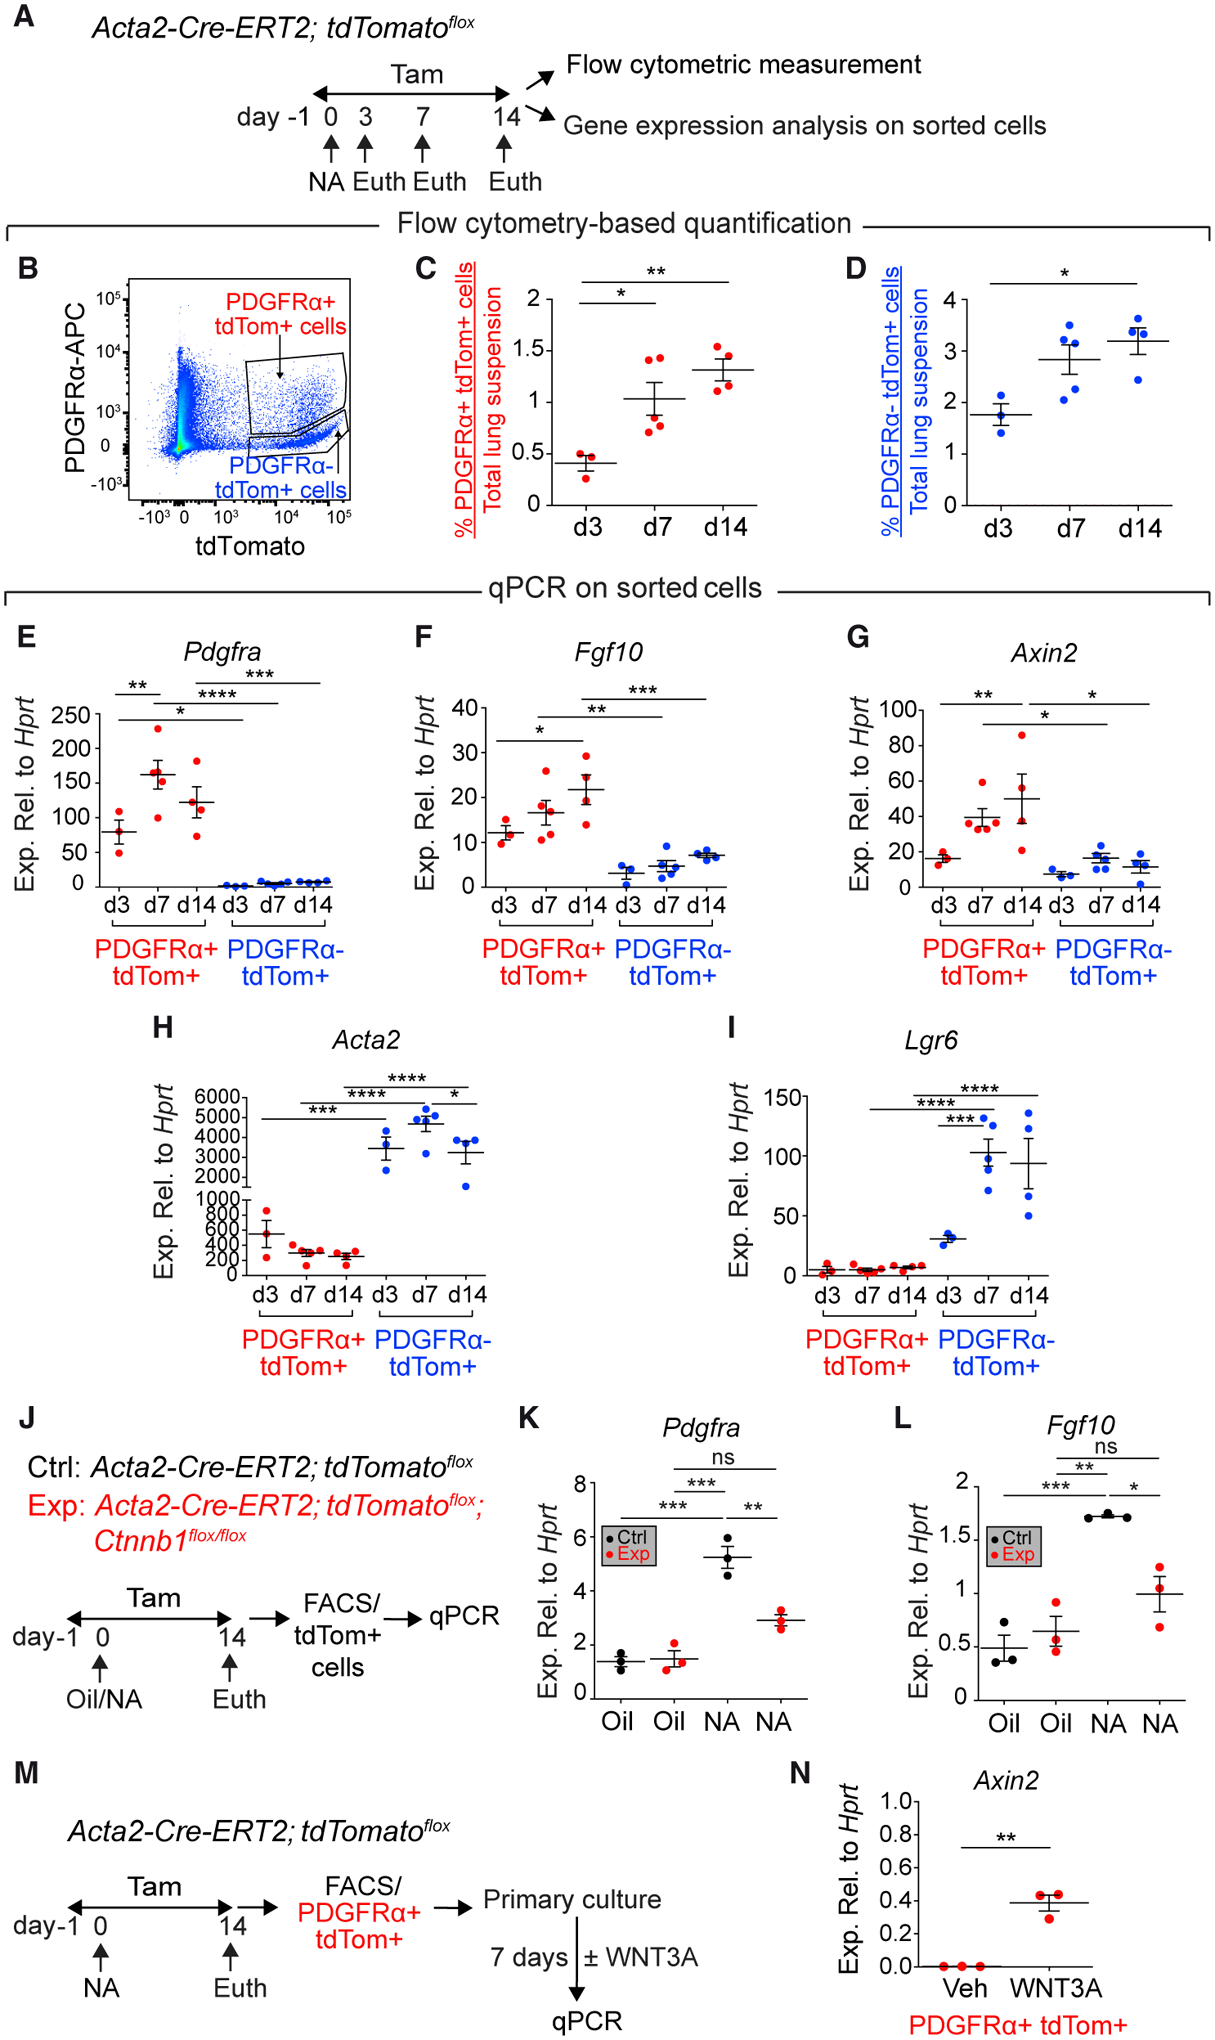
Figure 3. Dynamics of PDGFRα+ tdTomato+ Cells.

(A, J, and M) Experimental setup and timeline of NA and tamoxifen treatment. Mice were fed tamoxifen-containing food.
(B–D) Gating strategy and quantification of tdTomato+ cells.
(E–I) qPCR on sorted cells.
(K and L) qPCR on sorted tdTomato+ cells.
(N) qPCR on PDGFRα+ tdTomato+ cells.
n = 3 for d3, n = 5 for d7, and n = 4 for d14 (C–I); n = 3 per group (K, L, and N). Data are represented as means ± SEM. *p < 0.05, **p < 0.01, ***p < 0.001, ****p < 0.0001. See also Figure S2.
