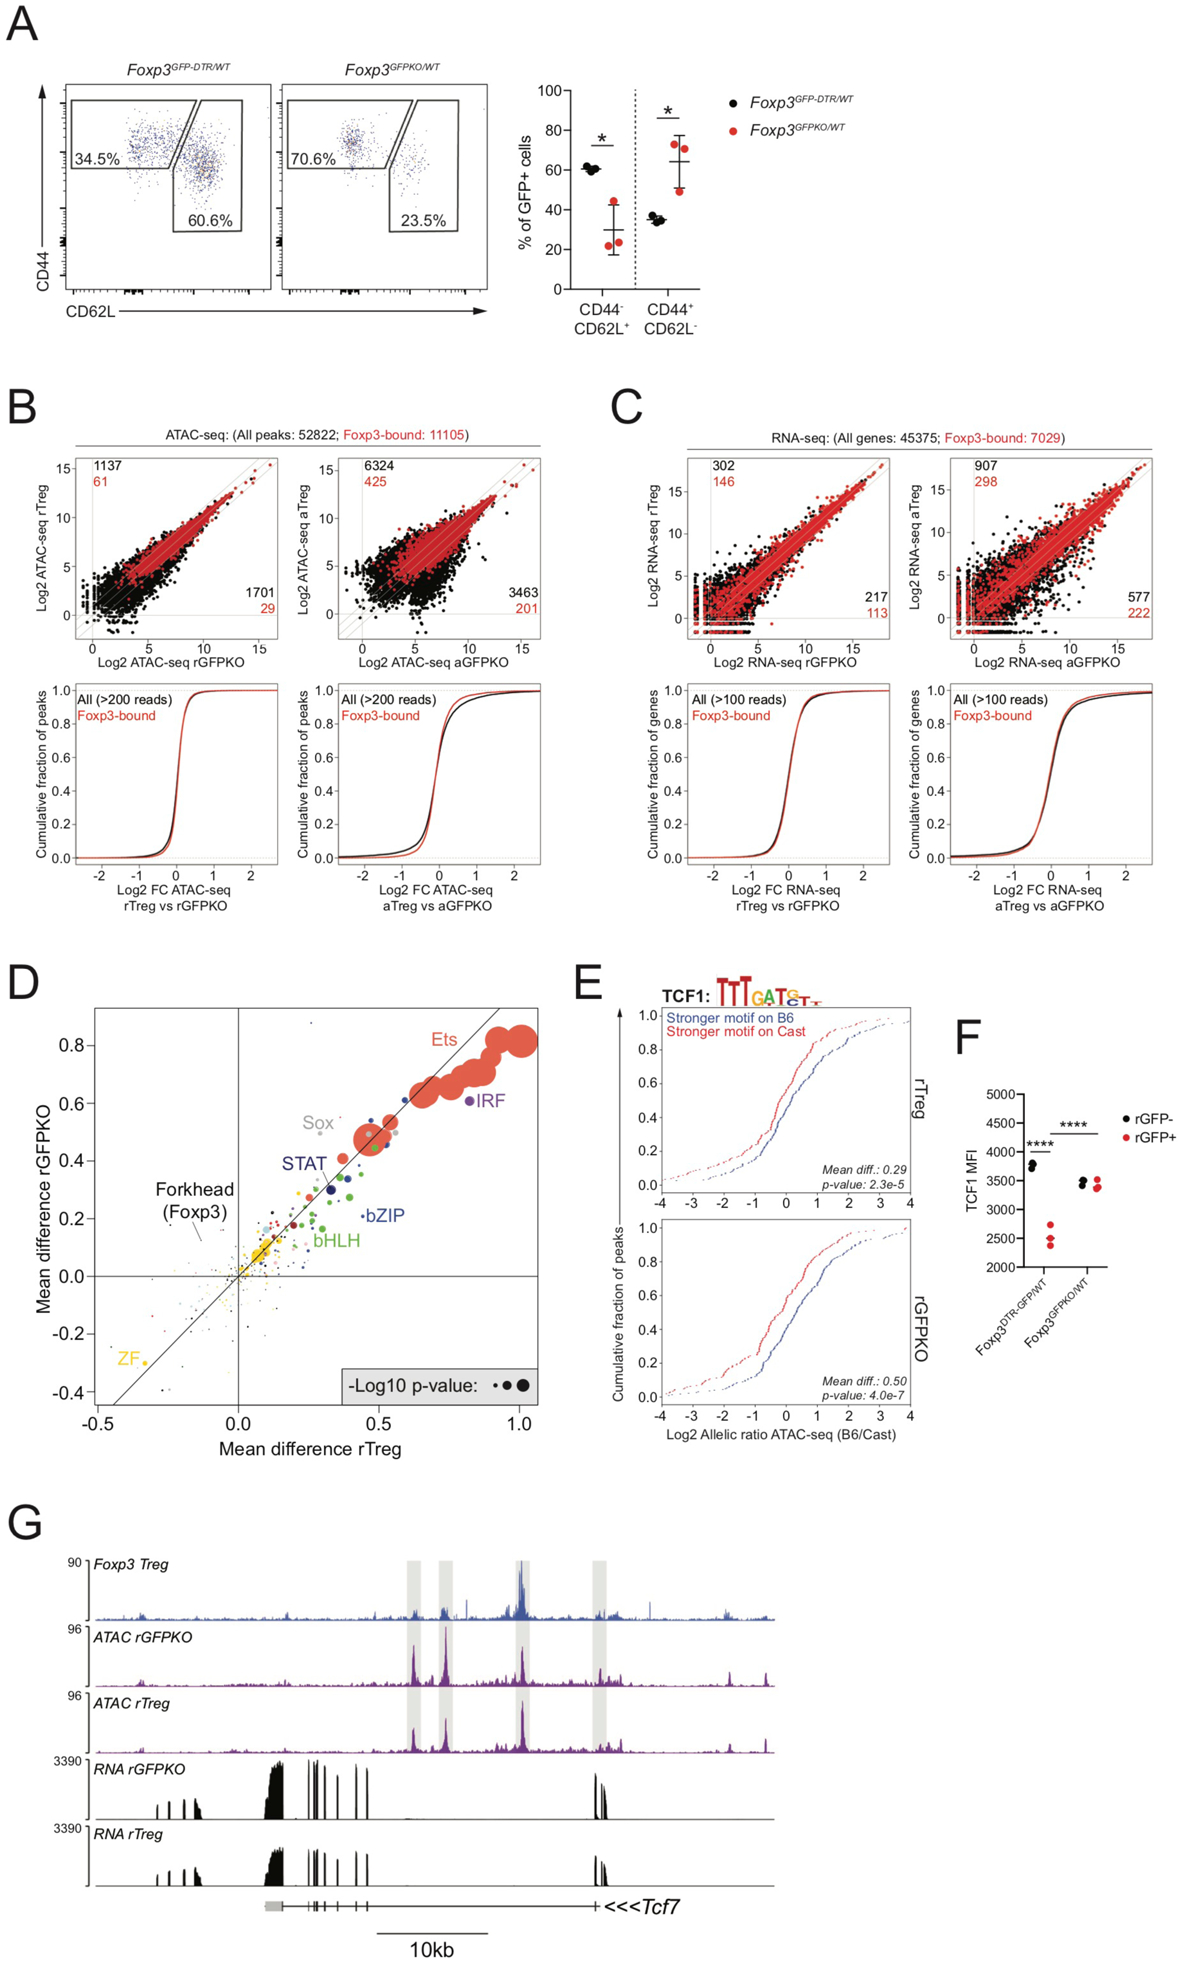
FIGURE 4: Foxp3-dependent chromatin accessibility changes are largely driven by trans-acting intermediates.

(A): CD44 and CD62L expression on GFP+ cells isolated from Foxp3DTR-GFP/WT and Foxp3GFPKO/WT B6/Cast F1 females.
(B): ATAC-seq analysis of CD44loCD62Lhi Treg (rTreg), CD44hiCD62Llo Treg (aTreg) and reporter-null expressing counterparts (rGFPKO and aGFPKO). Black dots: all ATAC-seq peaks, red dots: Foxp3-bound peaks. Number of all peaks (black) or Foxp3-bound peaks (red) undergoing >2-fold change in chromatin accessibility between cell types is shown. CDF plots (bottom) show quantification of accessibility changes.
(C): Similar to panel B, showing gene expression changes at all genes (black) and Foxp3-bound genes (red).
(D): Effect of TF binding motif variation on allelic bias in chromatin accessibility in rTreg and rGFPKO cells. Dots are colored according to TF family. See Figure S1.
(E): Effect of TCF1 motif variation on chromatin accessibility in rTreg (top) and rGFPKO (bottom) cells. Blue lines indicate peaks with stronger motif matches on the B6 allele, red lines indicate peaks with stronger motif matches on the Cast allele, as described in Figure S1.
(F): TCF1 protein levels in Treg and Foxp3GFPKO cells measured by flow cytometry. (****: p<0.0001; by two-way ANOVA).
(G): Track examples showing Foxp3 binding, chromatin accessibility, and gene expression at the Tcf7 locus.
