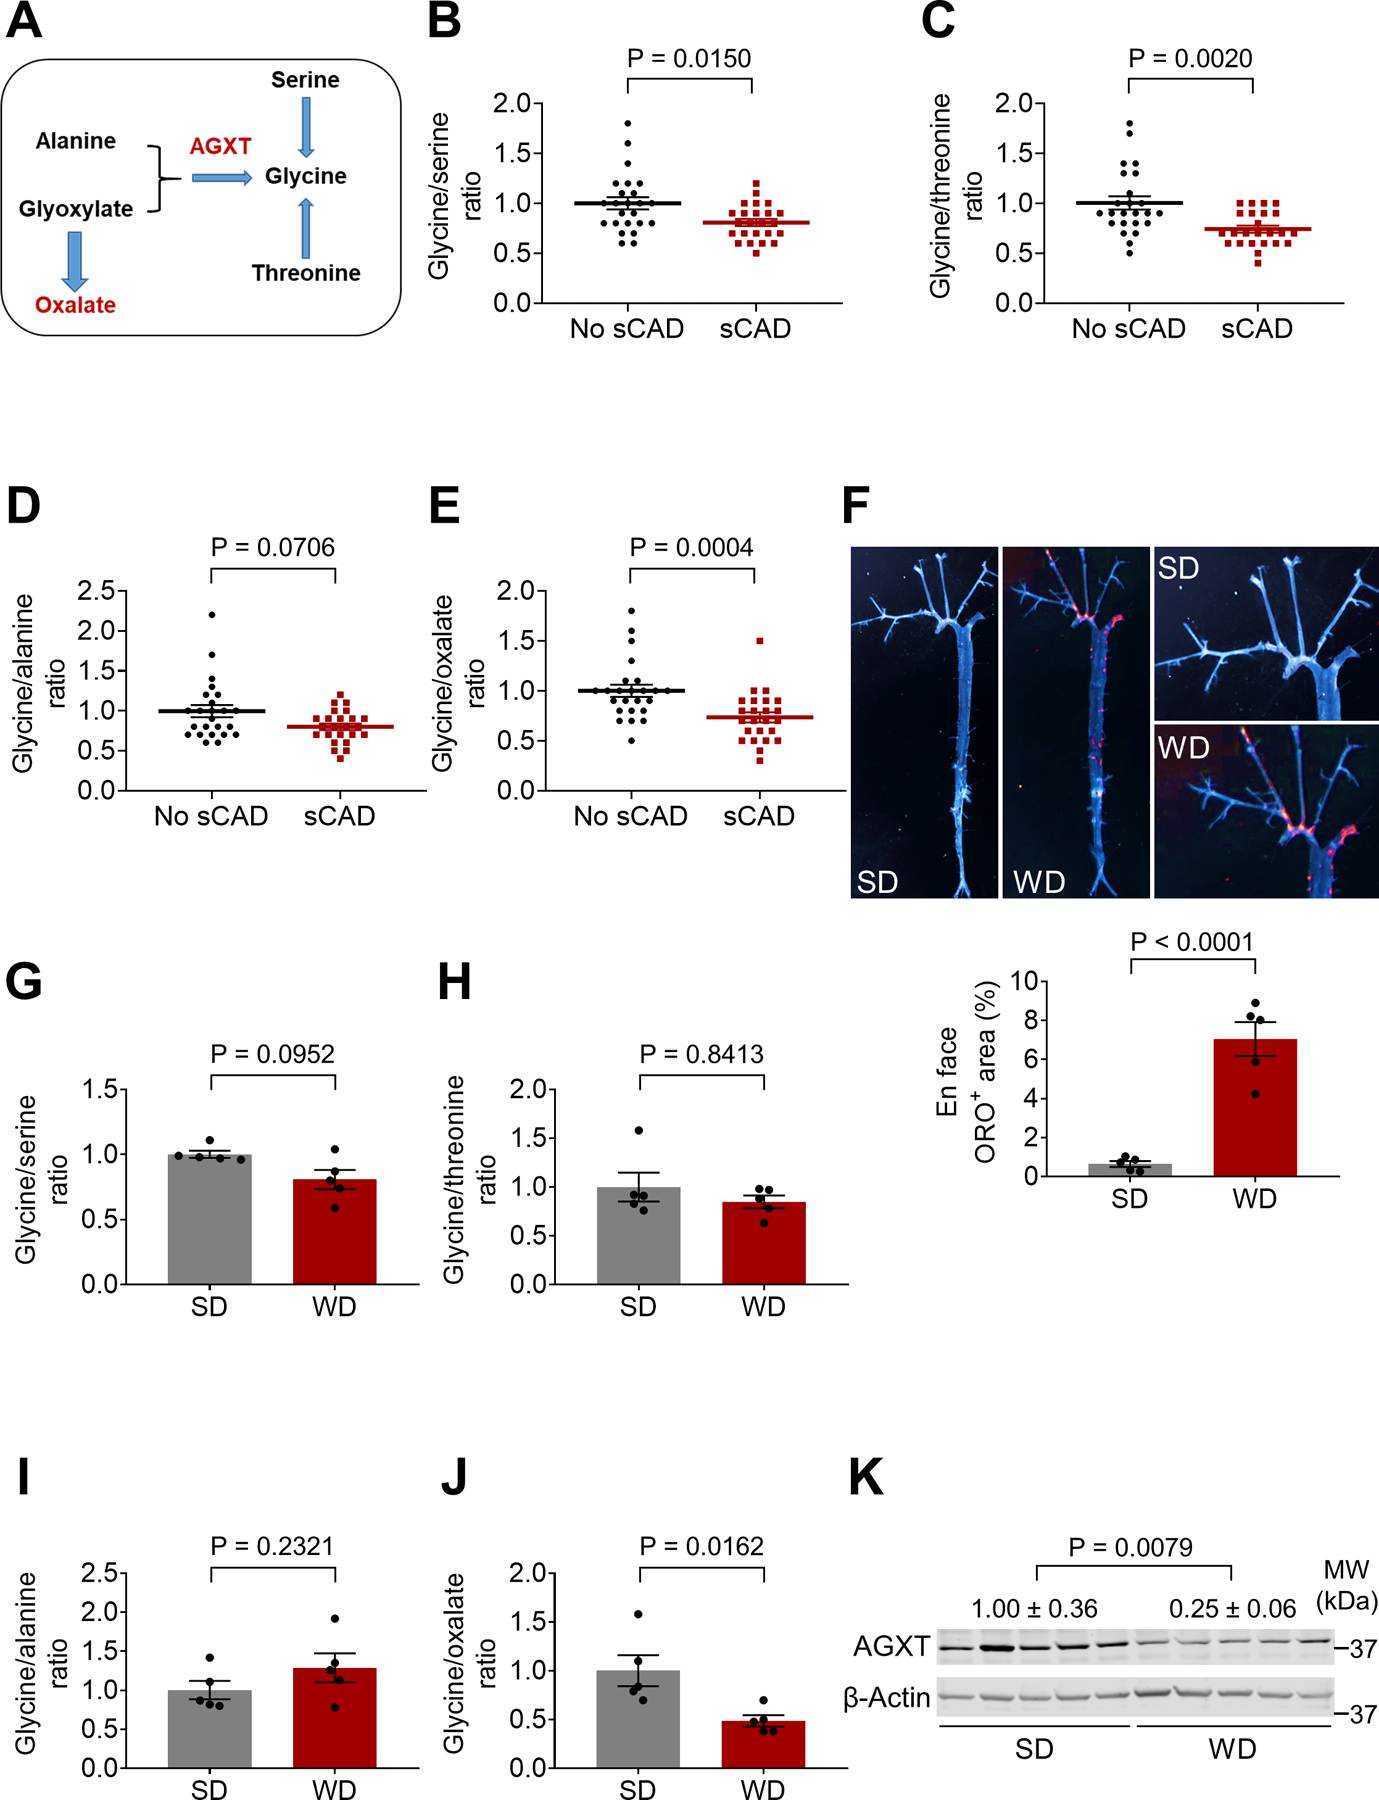
Figure 1. Dysregulated Glycine and Oxalate Metabolism in Patients and Mice with Atherosclerosis.

(A) Schematic representation of glycine metabolic pathways.
(B-E) Targeted metabolomics assessing the ratios of glycine to (B) serine, (C) threonine, (D) alanine and (E) oxalate in serum from age- and sex-matched patients with or without sCAD (n=24).
(F) En face analysis of atherosclerotic lesions in male Apoe−/− mice fed a standard diet (SD) or Western diet (WD) for 12 weeks (n=5).
(G-J) Targeted metabolomics assessing the ratios of glycine to (G) serine, (H) threonine, (I) alanine and (J) oxalate in plasma from male Apoe−/− mice fed a SD or WD for 12 weeks (n=5).
(K) Western blot analysis of AGXT protein abundance in livers from Apoe−/− mice fed a SD or WD for 12 weeks (n=5).
Mann-Whitney U test for B-E, G, H and K. Unpaired t test for F, I, J. Data are presented as mean ± SEM. All points and P values are shown.
