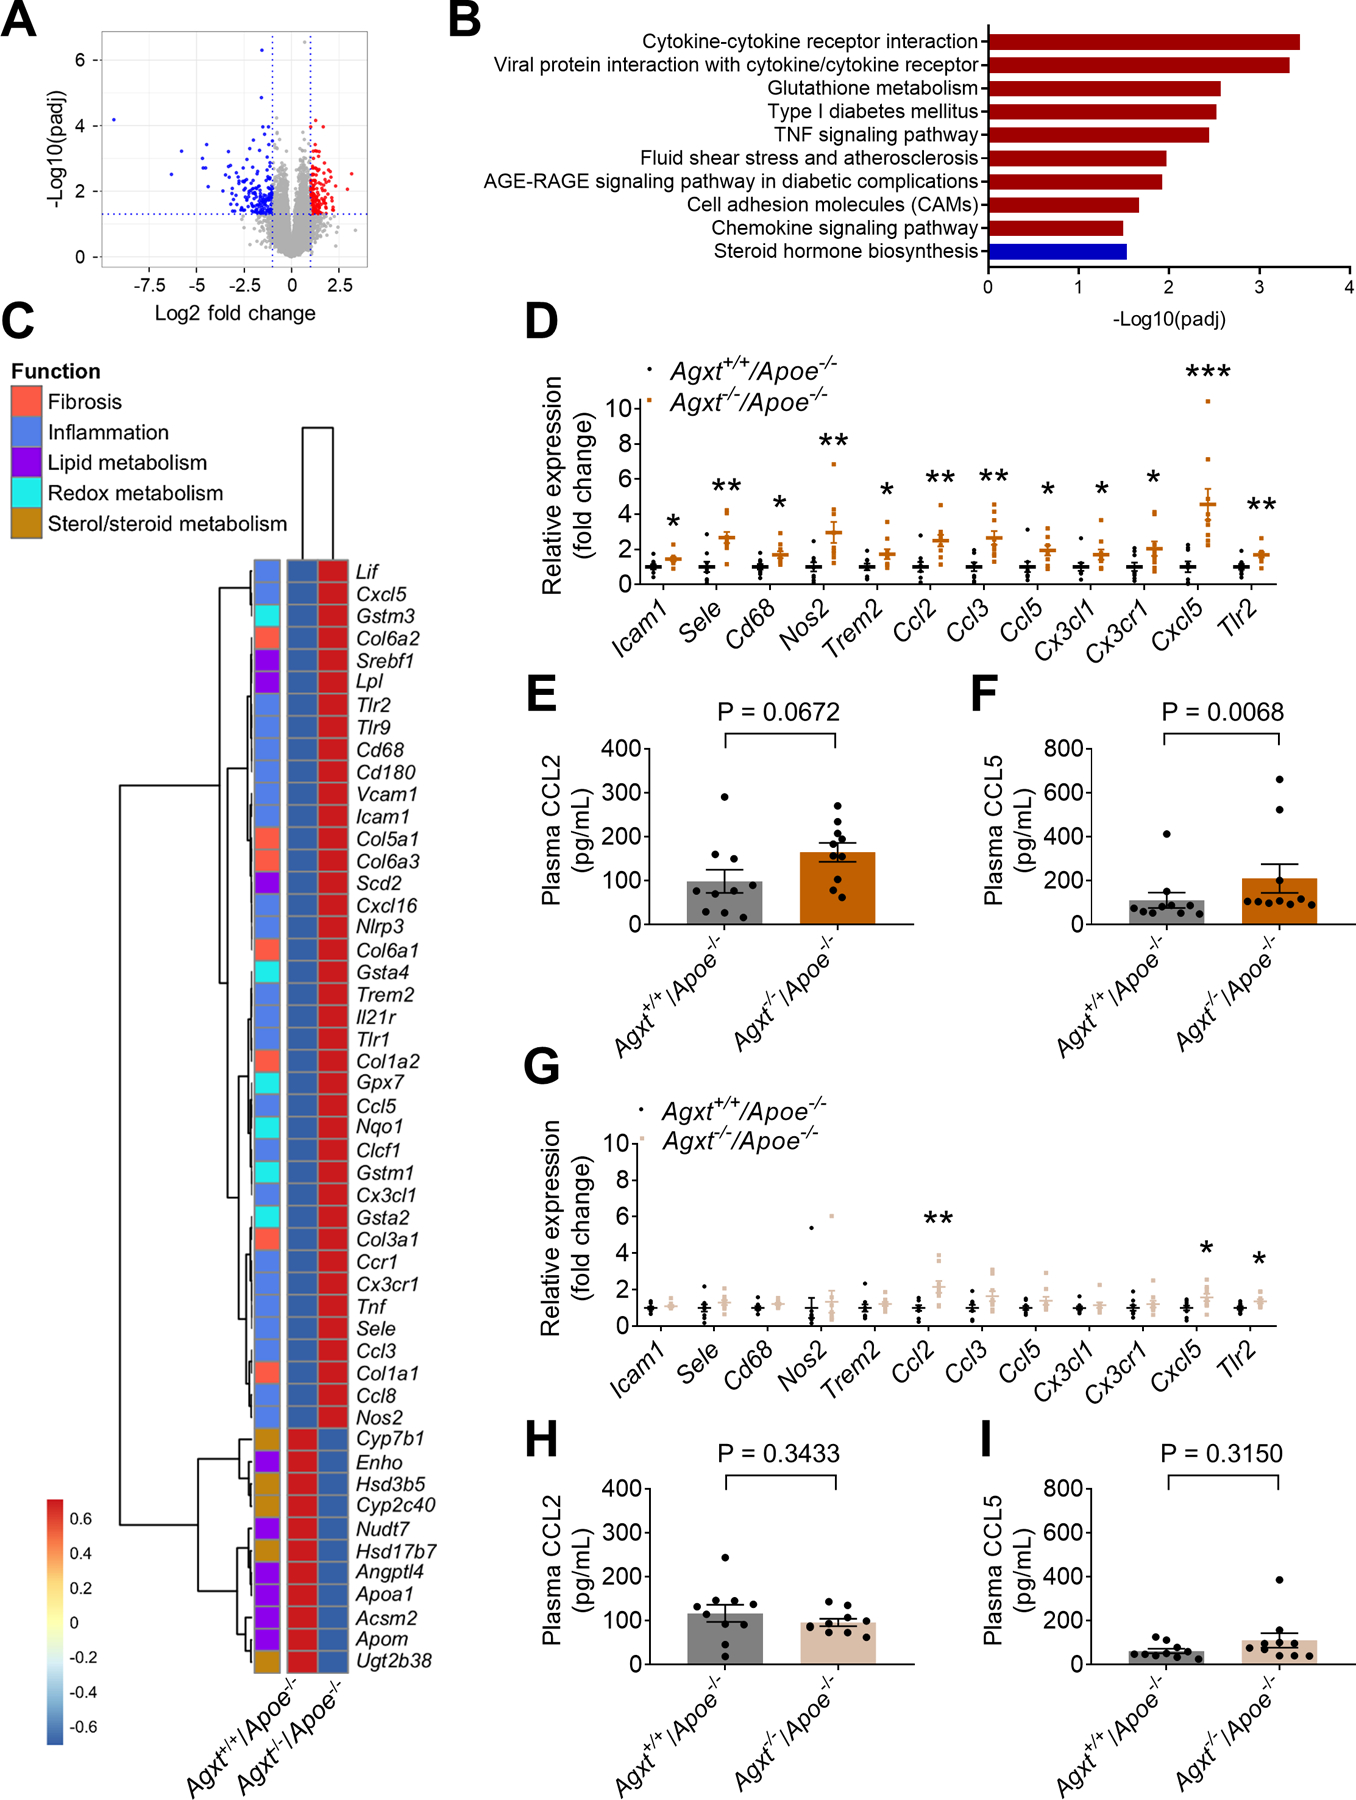
Figure 4. Dysregulated Oxalate Metabolism Induces a Pro-inflammatory Response and CCL5 Release.

(A-C) RNA-sequencing of livers collected from male Agxt−/−/Apoe−/− and Agxt+/+/Apoe−/− mice fed a WD for 12 weeks (n=5): (A) Volcano plot of DEGs (padj <0.05, log2 fold change >1) in male Agxt−/−/Apoe−/− vs. Agxt+/+/Apoe−/ mice (Blue: downregulated; Red: upregulated). (B) Kyoto Encyclopedia of Genes and Genomes (KEGG)-based pathway analysis. The significance of the enrichment was determined by right-tailed Fisher’s exact test followed by Benjamini-Hochberg multiple testing adjustment. (C) Heatmap-based representation of 50 DEGs linking inflammation, fibrogenesis and the metabolism of lipids and sterols/steroids with atherosclerosis.
(D) qPCR analyses using independent samples of DEGs regulating inflammatory responses in livers from male Agxt−/−/Apoe−/− vs. Agxt+/+/Apoe−/ mice (n=9). Gene expression levels were normalized to 18S.
(E) CCL2 concentrations in plasma from male Agxt−/−/Apoe−/− vs. Agxt+/+/Apoe−/ mice (n=10).
(F) CCL5 concentrations in plasma from male Agxt−/−/Apoe−/− vs. Agxt+/+/Apoe−/ mice (n=10).
(G) qPCR analyses of genes regulating inflammatory responses in livers from female Agxt−/−/Apoe−/− vs. Agxt+/+/Apoe−/ mice (n=9). Gene expression levels were normalized to 18S.
(E) CCL2 concentrations in plasma from female Agxt−/−/Apoe−/− vs. Agxt+/+/Apoe−/ mice (n=10).
(F) CCL5 concentrations in plasma from female Agxt−/−/Apoe−/− vs. Agxt+/+/Apoe−/ mice (n=10).
Statistical differences in gene expression (D and G) were tested using unpaired t test or Mann-Whitney U test, depending on normality tests. *P<0.05, **P<0.01, ***P<0.001 vs. Agxt+/+/Apoe−/− mice. Unpaired t test for E and H. Mann-Whitney U test for F and I. Data are presented as mean ± SEM.
