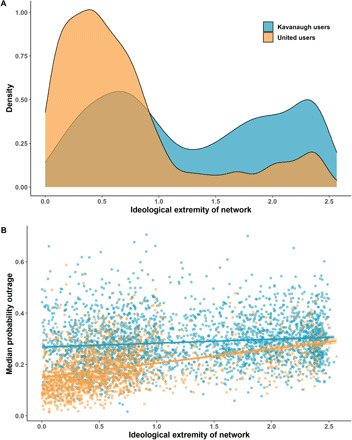
Fig. 1. Distributions of ideological extremity of user networks and levels of outrage expression.

(A) Density plots of the ideological extremity of user networks for the Kavanaugh dataset (study 1) and United dataset (study 2). The x axis represents a continuous estimate of the mean ideological extremity of a user’s network; greater values represent greater extremity. (B) Each user’s median probability of expressing outrage in their tweets as a function of the ideological extremity of their network.
