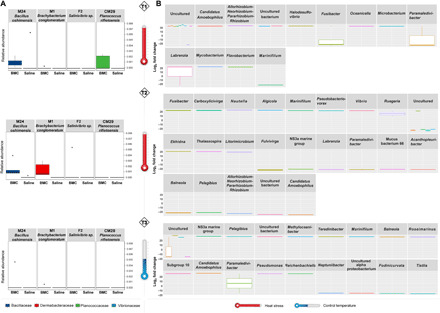
Fig. 2. Effects of BMC treatment on coral bacterial community.

(A) Relative abundance of BMC consortium members in coral fragments treated with BMCs or placebo and exposed to heat stress (T1, P = 0.028; T2, P = 0.0001; T3, P = 0.265; Kruskal-Wallis), where boxes represent the relative mean abundance and stars represent outliers. (B) Boxplot of fold change (FC) of ASVs with differential abundance (P = 0.01) in BMC-treated coral fragments compared with placebo-treated fragments at T1, T2, and T3. Bars with the same color scale belong to the same taxonomic family.
