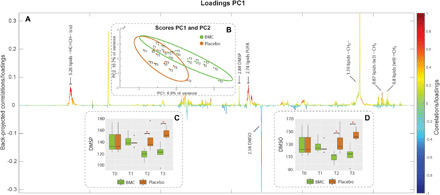
Fig. 4. Metabolic restructuring due to BMC treatment and heat stress.

Color-coded loading plot (A) (in which colors indicate variation intensity) and score plot with 95% confidence ellipses showing sample clustering by PLS-DA (B) from PLS-DA of the 1H NMR dataset comparing the metabolic patterns from coral fragments treated with BMCs and placebo during the thermal stress experiment. Peaks from the loading plot (resonances from annotated as lipids, DMSP, and DMSO) pointing upward are correlated with BMC-treated samples (grouped in the positive quadrant of PC1 (in the score plot), and those pointing downward are correlated with the placebo samples [grouped in the negative quadrant of PC1 (Principal Components 1) in the score plot]. Boxplots are provided to access semiquantitative evaluations of the characteristic DMSP peak at 2.88 ppm (C) and DMSO peak at 2.58 ppm (D) across sampling time and treatment independently.
