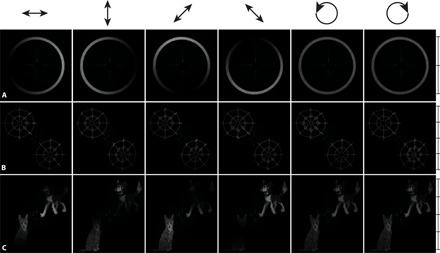
Fig. 4. Parallel polarization analysis by a metasurface Jones matrix hologram.

Four examples of Jones matrix holograms (A, B, and C, each described in Results) are shown in which incident light is directed to the far-field in accordance with its projection onto arbitrarily selected analyzer polarizations across the far-field. Each column corresponds to an incident polarization (depicted at the top). Scale bars at the right side of each row show the angular bandwidth of the hologram, with each division corresponding to 15∘ centered about 0∘. These holograms are measured with a polarimetric relay imaging system described in the Supplementary Materials (section S1D). Larger-form versions of the images—and animations of their response with changing polarization—are also provided in the Supplementary Materials (movies S1 to S3). The color map of this figure is identical to that of Fig. 3.
