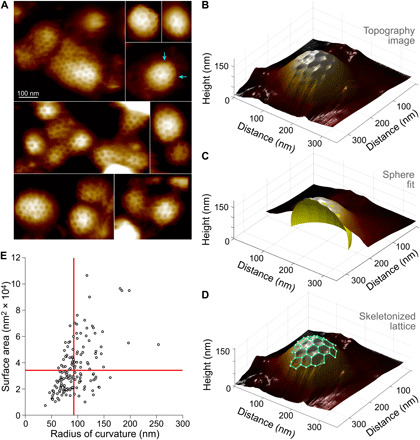
Fig. 1. HS-AFM 3D morphology analysis of CCPs on plasma membranes of freshly unroofed PTK2 cells.

(A) CCPs of various sizes and morphologies observed on plasma membranes of freshly unroofed PTK2 cells (arrows indicate examples of pentagonal insertions). (B) 3D representation of an individual CCP. (C) Spherical sector (yellow spherical cap) fit of an individual CCP. The fit determines the CCP radius of curvature and surface area (above 0-height level defined by the background height of the surrounding membrane). (D) Partial skeleton of clathrin lattice (green lines). The lattice skeleton describes the conformation of each clathrin triskelion in 3D space. (E) Distribution analysis of n = 128 CCPs visualized by HS-AFM according to their surface area versus radius of curvature. The observed distribution of the CCP area and radius of curvature does not follow the predictions of the constant area (horizontal red line) and constant curvature (vertical red line) models obtained from the mean CCP surface area and radius of curvature, respectively (see fig. S1).
