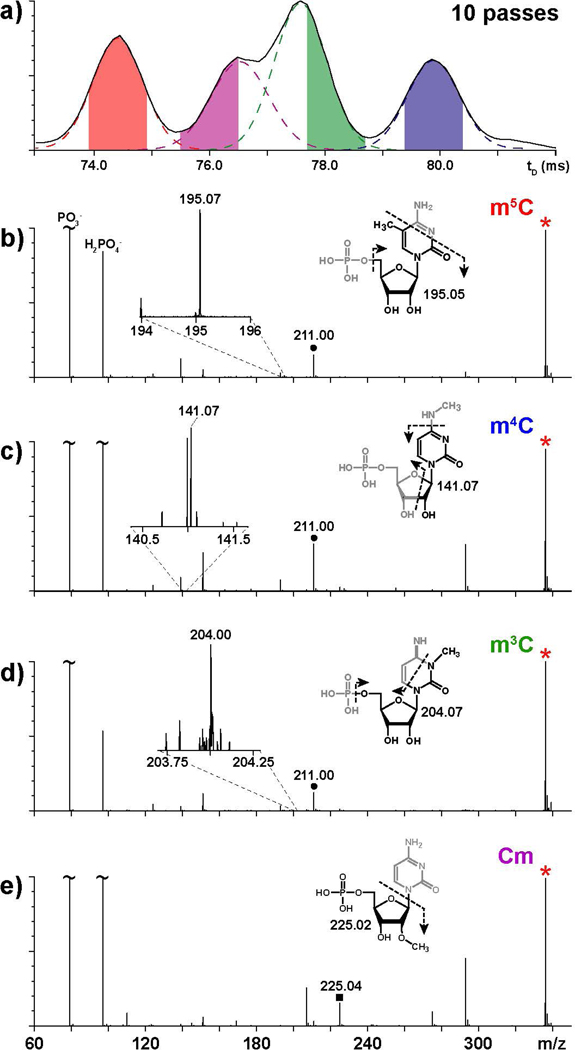
Figure 4.
Mass-selected time-resolved (MaSTeR) dissociation spectra obtained from the equimolar mixture of methyl-cytidine isomers. Panel a) shows the windows of tD from which the various product ion spectra were obtained (see Experimental). In particular, panel b) corresponds to the population emerging at 74.4 ±0.5 ms; c) at 79.9 ±0.5 ms; d) at 78.2 ±0.5 ms; and e) at 76.0 ±0.5 ms. Precursor ions are marked with a red asterisk, whereas signals produced by base loss are marked with black circles or squares.

