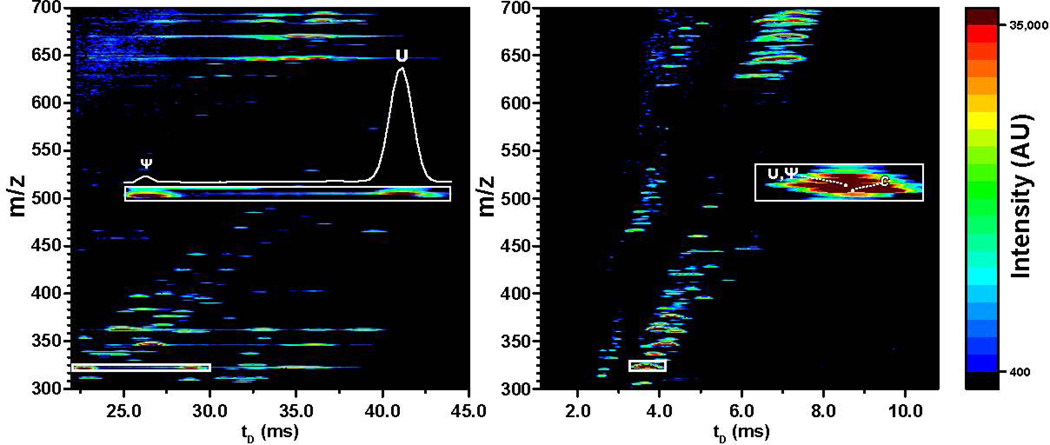
Figure 5.
Heatmap plots obtained by cIM after 3 passes (left) and linear TW (right) analysis of an exonuclease digestion mixture from total RNA extract of HeLa cells (see Experimental). The cIM separator fully resolved the uridine (U) and pseudo-uridine (Ψ) isomers, whereas the linear TW device displayed extensive overlap (insets).

