
Fig. 3.
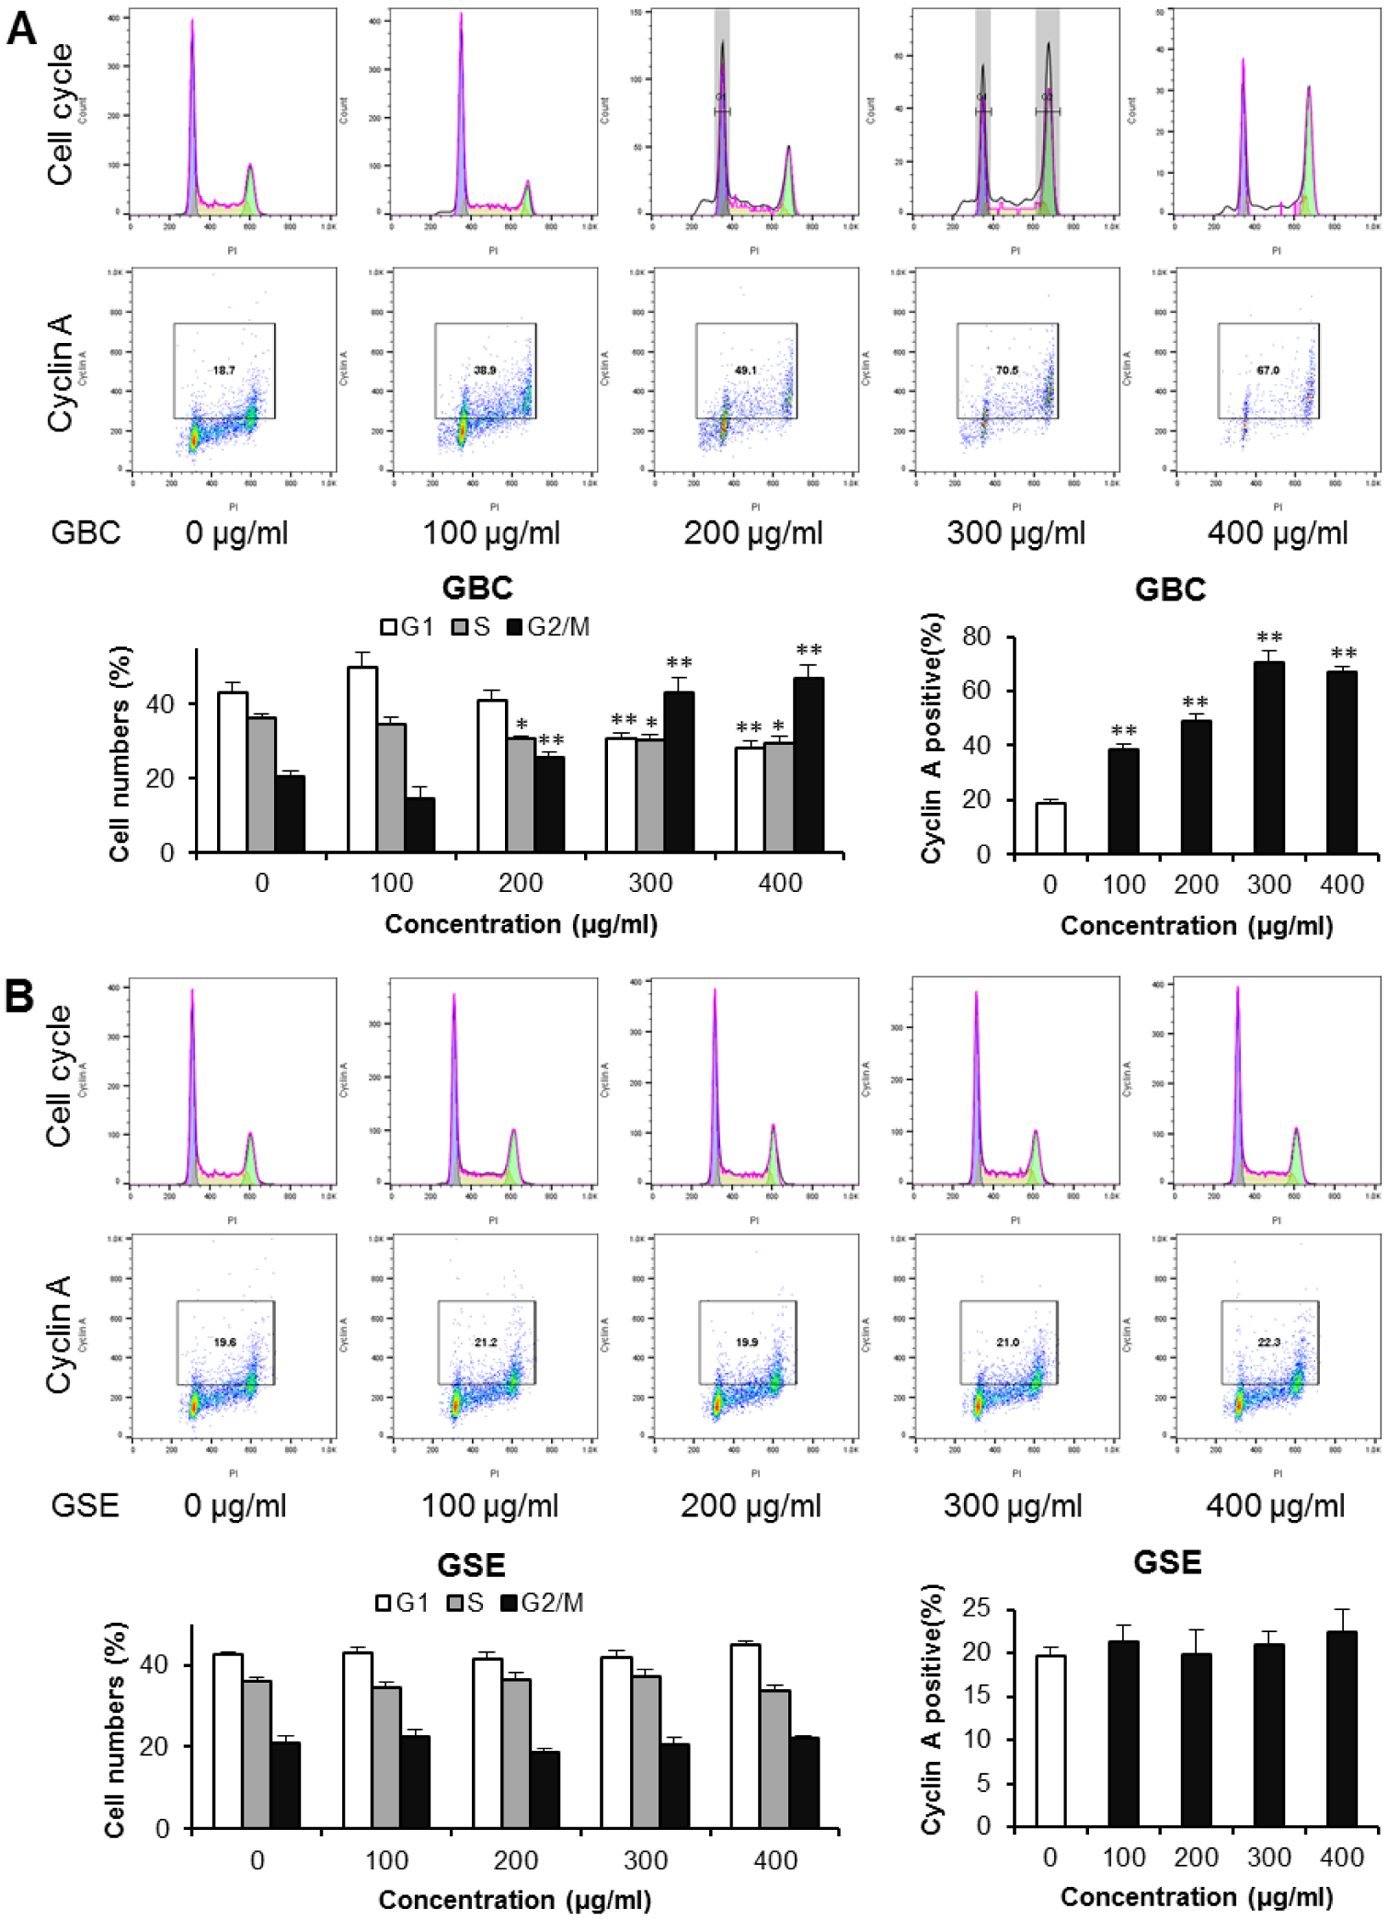
Effects of GBC and GSE on cell cycle arrest and the expression of cyclin A. HCT-116 cells were treated with 100, 200, 300, and 400 μg/ml of GBC and GSE for 48 h. The cell cycle and cyclin A were assessed with PI/RNase and cyclin A-FITC staining using flow cytometry. [A]: The representative histograms of DNA content in different experimental groups (upper panel), and percentage of each cell cycle phase in different groups (lower panel). [B]: The expression of cyclin A. The numbers in the gates are the percentage of cyclin A positive cells (upper panel), and percentage of cyclin A-positive cells in different groups (lower panel). Data obtained from triplicate experiments. * P < 0.05; ** P < 0.01 compared to control.