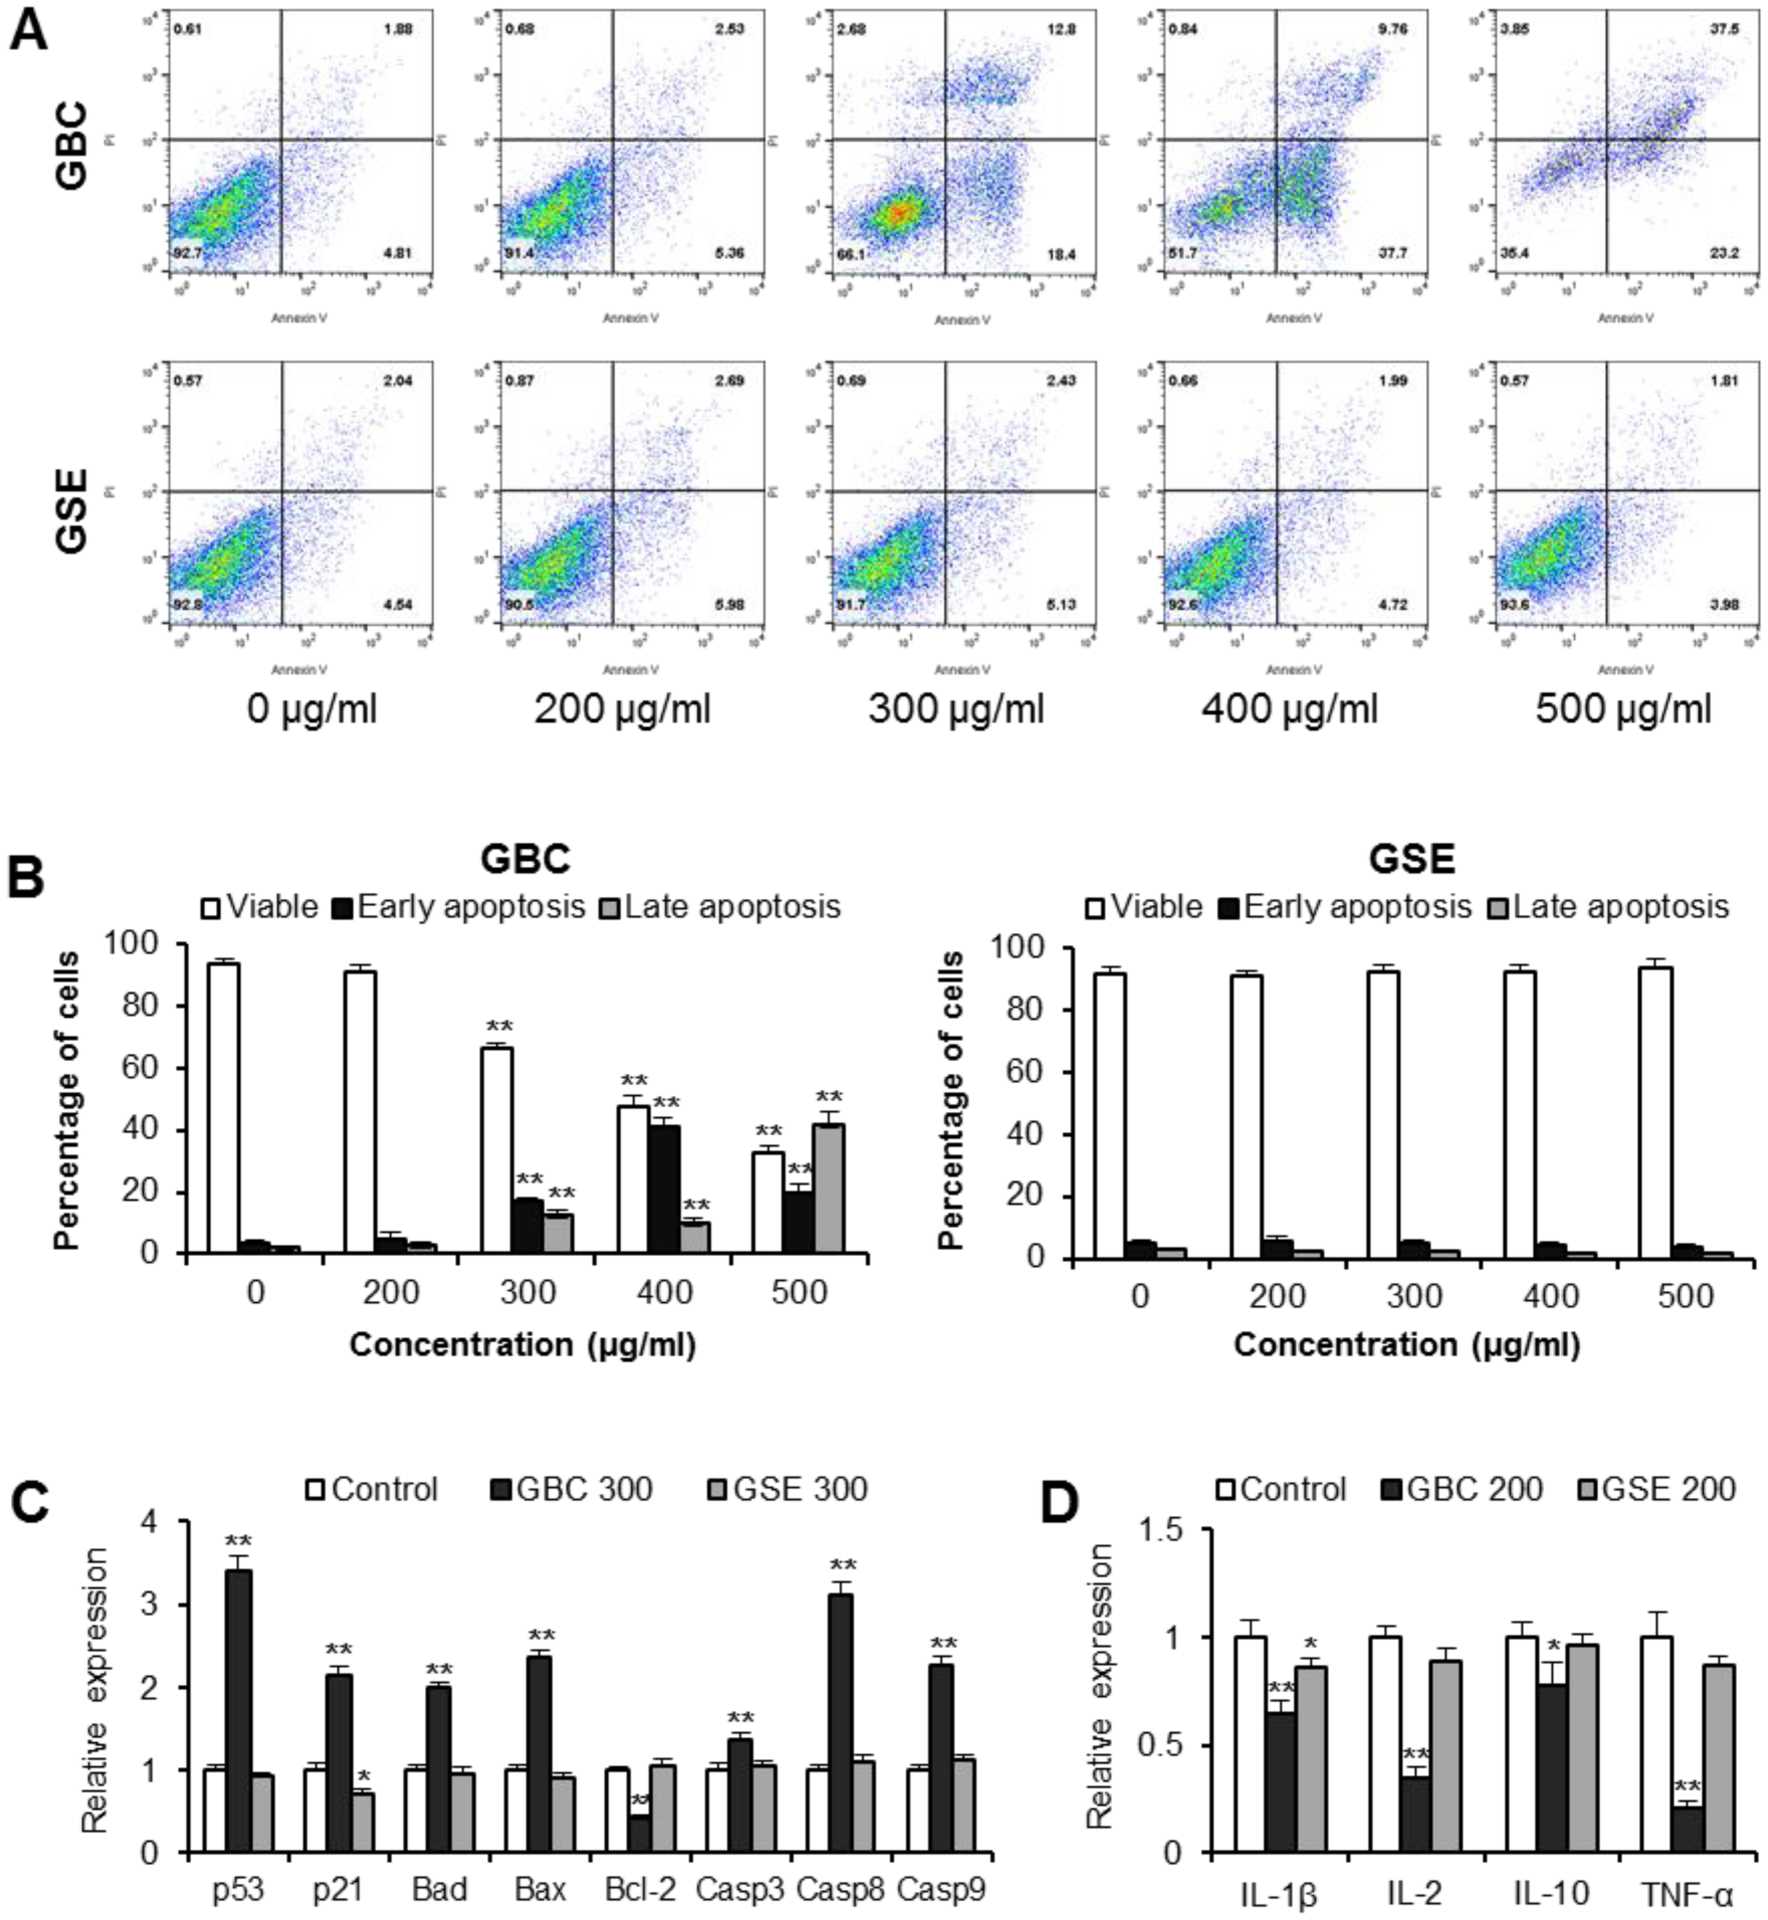
Fig. 4.

Apoptosis and inflammatory cytokine analysis of cells treated with GBC and GSE. [A]: Representative scatter plots of PI (y-axis) versus annexin V (x-axis). HCT-116 cells were treated with 200–500 μg/ml of GBC and GSE for 48 h. Apoptosis was quantified using annexin V-FITC/propidium iodide (PI) staining followed by flow cytometric analysis. [B]: Percentage of viable, early apoptotic, and late apoptotic cells. [C]: HCT-116 cells were treated with 300 μg/ml of GBC and GSE for 24 h. Expression of apoptotic related genes assayed by real-time PCR. [D]: HT-29 cells were treated with 10 ng/ml of LPS and 200 μg/ml of GBC and GSE for 6 h. Expression of inflammatory cytokine genes assayed by real-time PCR. Data are presented as the mean ± standard error of triplicate experiments. * P < 0.05, ** P < 0.01 vs. control.
