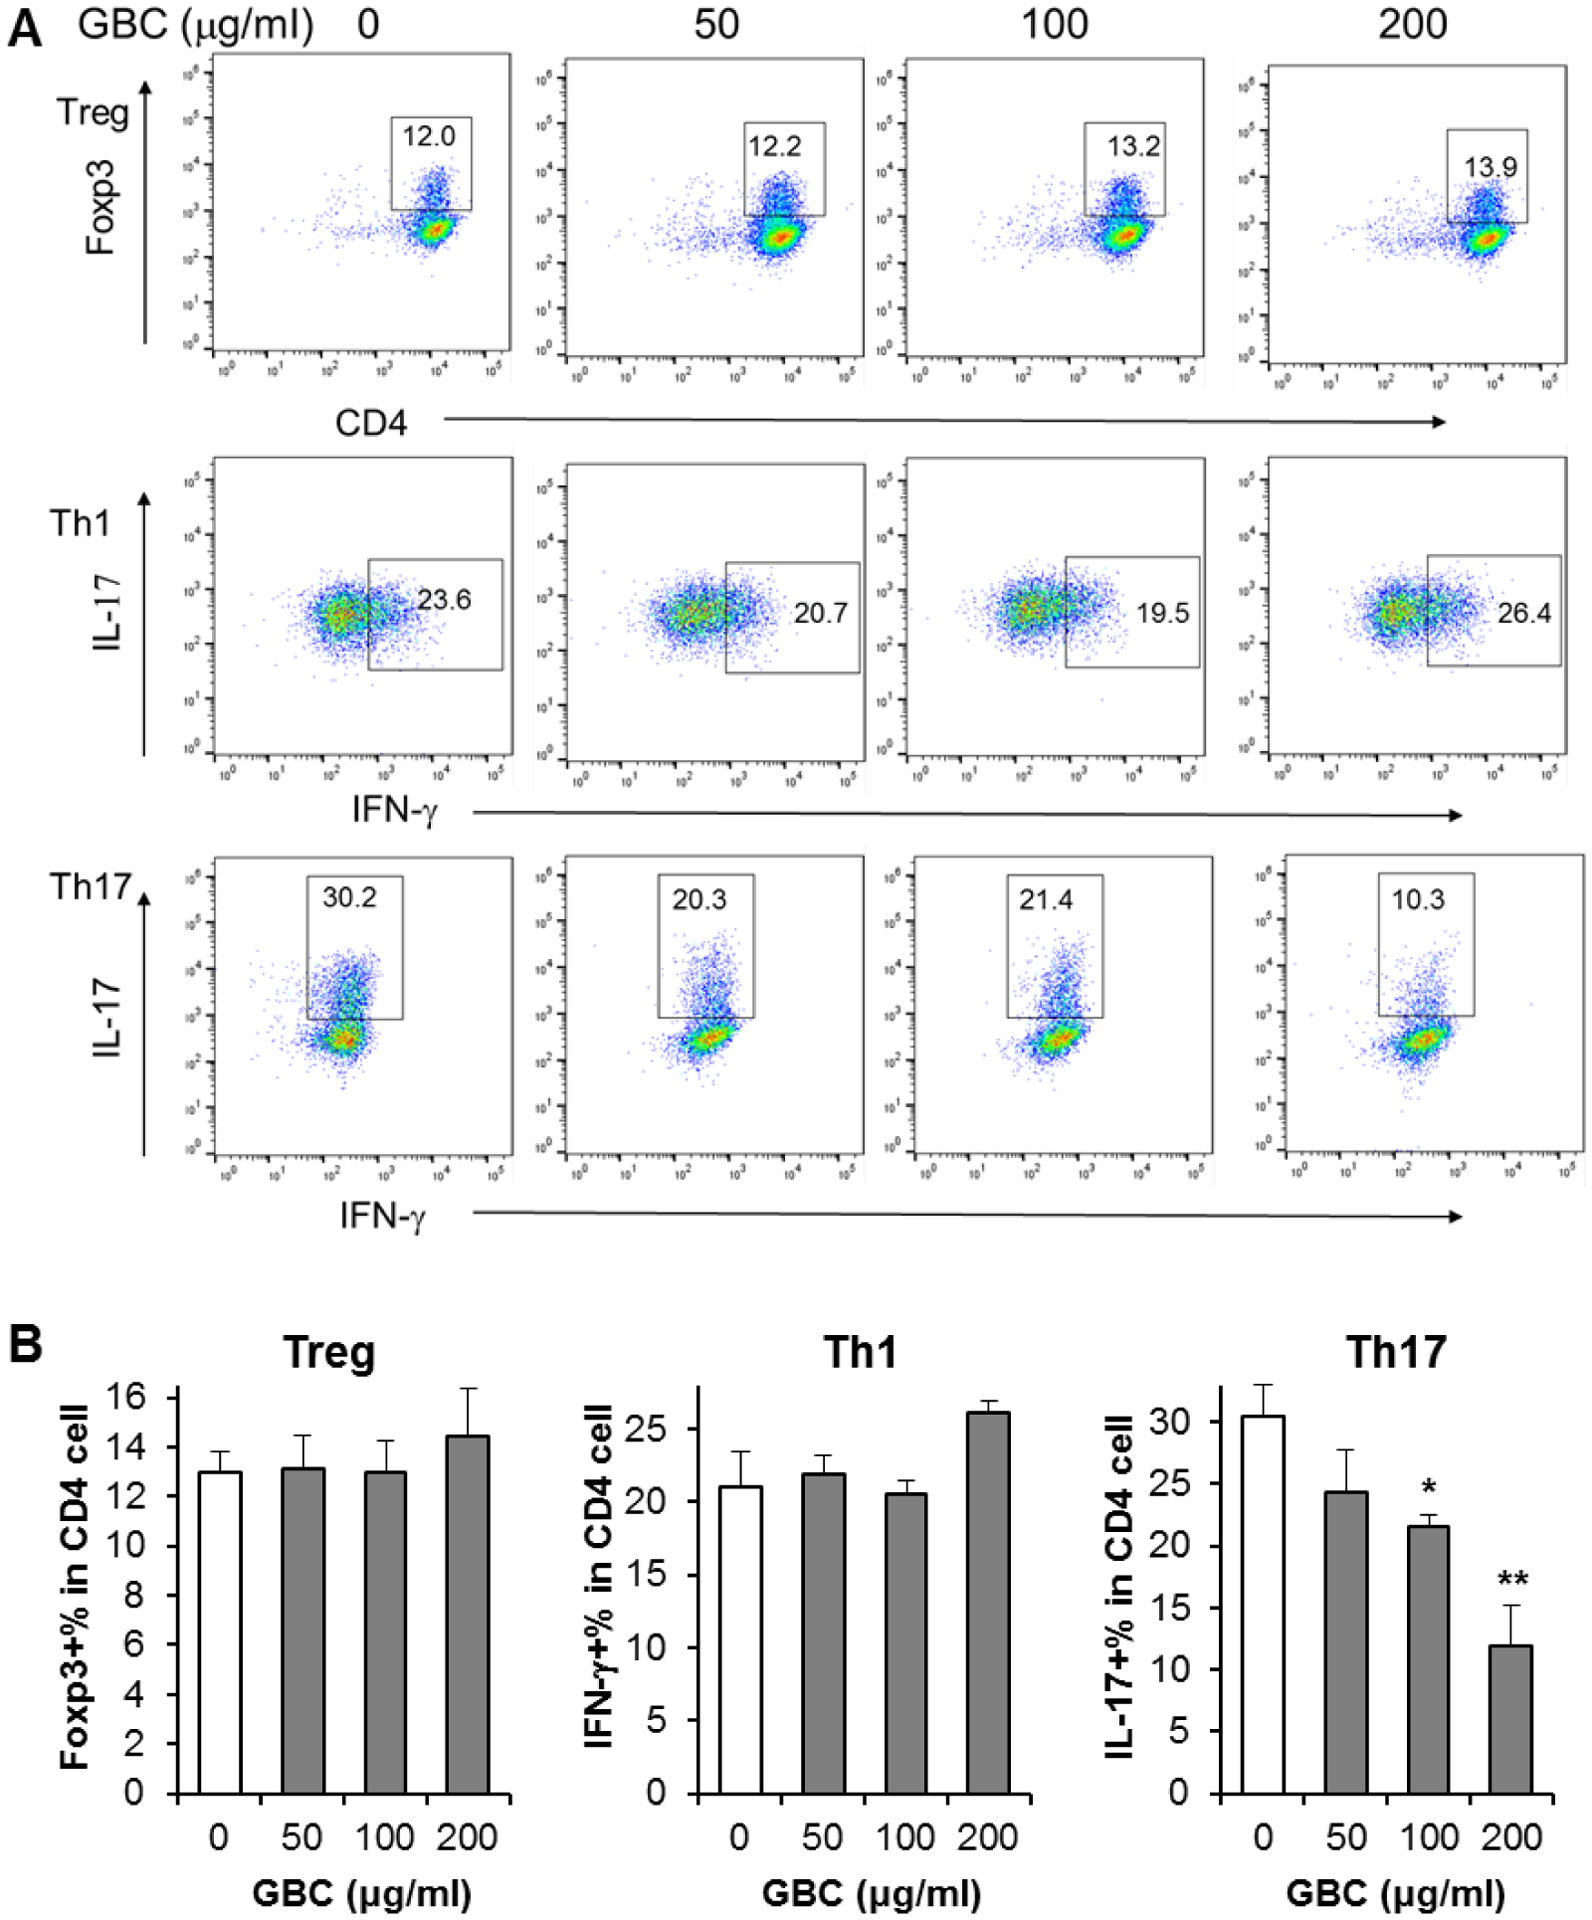
Fig. 5.

Effect of GBC on Treg, Th1, and Th17 cell differentiation. [A]: Representative scatter plots assayed by flow cytometry. The numbers in the gates are the percentage of each type of T cells. [B]: Data are presented as the mean ± standard error of triplicate experiments. * P < 0.05, ** P < 0.01 vs. control.
