
Fig. 1. MAPK activity is temporally integrated throughout the mother cell cycle to control daughter cell proliferation, whereas CDK4/6 activity is only required in early G1.
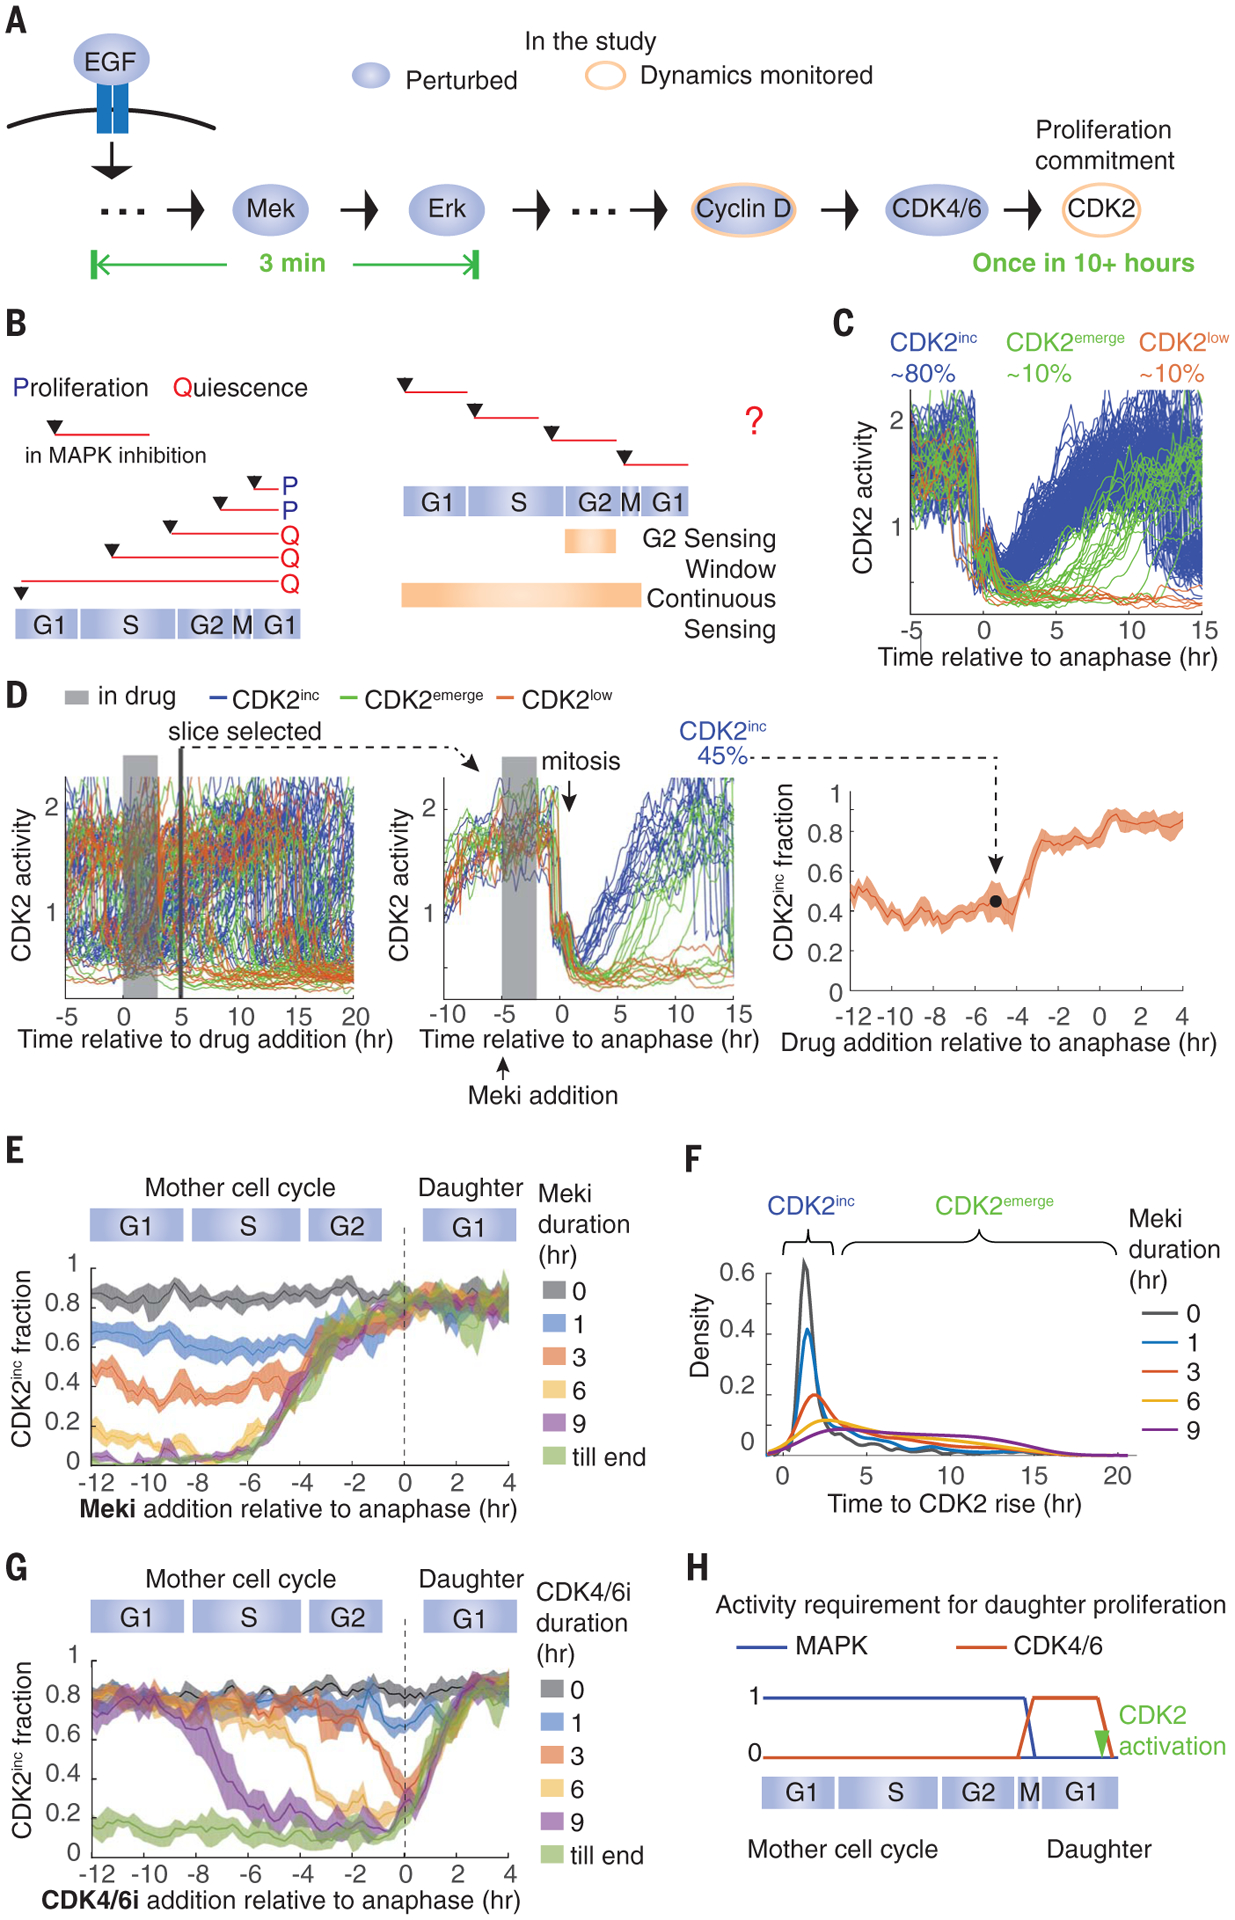
. (A) Transduction of mitogen signals to cell cycle machinery. EGF, epidermal growth factor. (B) (Left) Depiction of previous MAPK inhibition experiments. (Right) Two potential models of mitogen sensing: Cells sense mitogen availability only in the mother cell G2 or continuously throughout the mother cell cycle. (C) Typical cell CDK2 activity in optimal growth conditions. hr, hour. (D) Data processing for establishing daughter cell fate as a function of the time of drug addition, read out as CDK2 activity. (Left) CDK2 activity in asynchronously cycling cells. In this example, cells were treated with Meki for 3 hours before the drug was washed off. (Middle) Traces from cells that underwent mitosis 5 hours after drug addition were extracted and the fraction of CDK2inc daughter cells was calculated. (Right) Repeating this process for every time slice generates the plot of fraction of CDK2inc daughter cells versus the time of drug addition relative to anaphase. (E) Fraction of CDK2inc daughter cells treated with 0, 1, 3, 6, or 9 hours Meki or Meki until the end (till end) of the experiment, at various times relative to anaphase. (F) Density distribution of the time between anaphase and the rise of CDK2 activity in CDK2inc and CDK2emerge daughter cells. Cells were treated with Meki for the indicated durations starting from the G1 phase of the mother cell cycle. Areas under the curves were normalized to 1. (G) Same as in (E) except with CDK4/6i treatment. (H) Summary of the data. All data are from MCF10A cells; all CDK2inc fractions are plotted as means ± 95% confidence intervals shown as shaded bands, where nonoverlapping shading indicates a statistically significant difference as determined by t test, with P < 0.05.