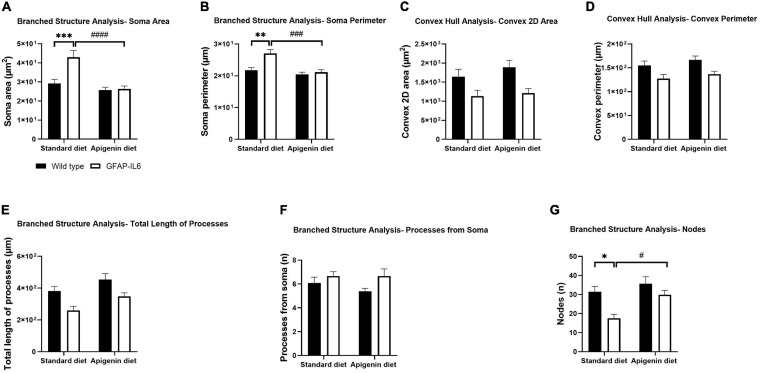
FIGURE 4.
Effects of apigenin diet on Iba-1+ microglial cell morphology in the hippocampus. Quantitative analysis of the morphological changes in Iba-1+ microglia, including (A) soma area (μm2), (B) soma perimeter (μm), (C) convex 2D area (μm2), (D) convex perimeter (μm), (E) process length (μm), (F) number of processes from soma (n), and (G) number of nodes (n). Data presented as mean ± SEM and analyzed with two-way ANOVA followed by Bonferroni post hoc tests. Post hoc effects of “genotype” are represented in asterisks (∗p < 0.05, ∗∗p < 0.01, ∗∗∗p < 0.001, ****p < 0.0001); post hoc effects of “diet” are represented by hash symbols (#p < 0.05, ##p < 0.01, ###p < 0.001, ####p < 0.0001).

