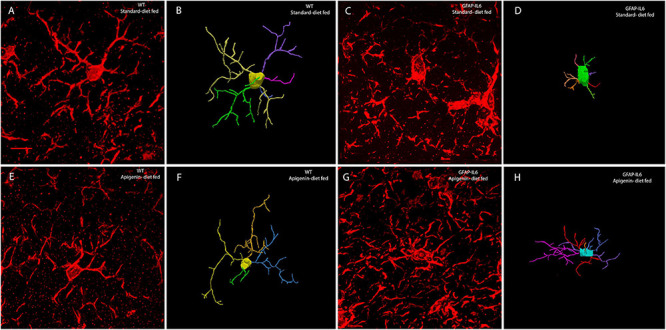
FIGURE 5.

Representative confocal images of reconstructed microglia from WT standard diet-fed (A,B), GFAP-IL6 standard diet-fed (C,D), WT apigenin-fed (E,F), and GFAP-IL6 apigenin-fed (G,H) cohorts. The extended depth of focus images obtained from collapsing 3D confocal microscopy images of Iba-1+ microglia obtained under 63× oil immersion objective, along with the corresponding manually reconstructed images in Neurolucida 360. GFAP-IL6 mice (apigenin diet) (G,H) had a significantly reduced soma area, soma perimeter and a larger number of nodes than that of GFAP-IL6 mice (standard diet) (C,D). (Scale bar 10 μm).
