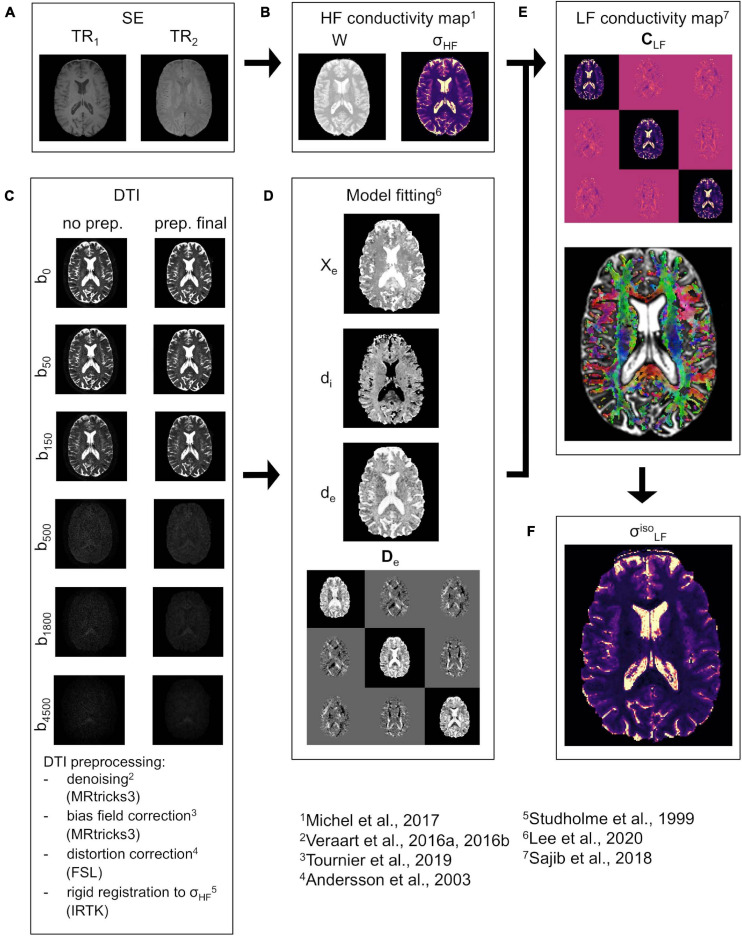
FIGURE 1.
CTI reconstruction framework. (A) SE data acquired at TR1 and TR2. (B) Water map W and isotropic conductivity σHF map. (C) DTI data before (left) and after (right) pre-processing at all b-values (vertical direction, diffusion encoding direction chosen at random). (D) Estimated extracellular volume fraction χe, intra and extracellular water diffusivities di and de, and extracellular water diffusion tensor De. (E) LF conductivity tensor CLF (top) together with the orientation distribution function (ODF) representation (bottom) in WM and GM. (F) “isotropic equivalent” LF conductivity map .

