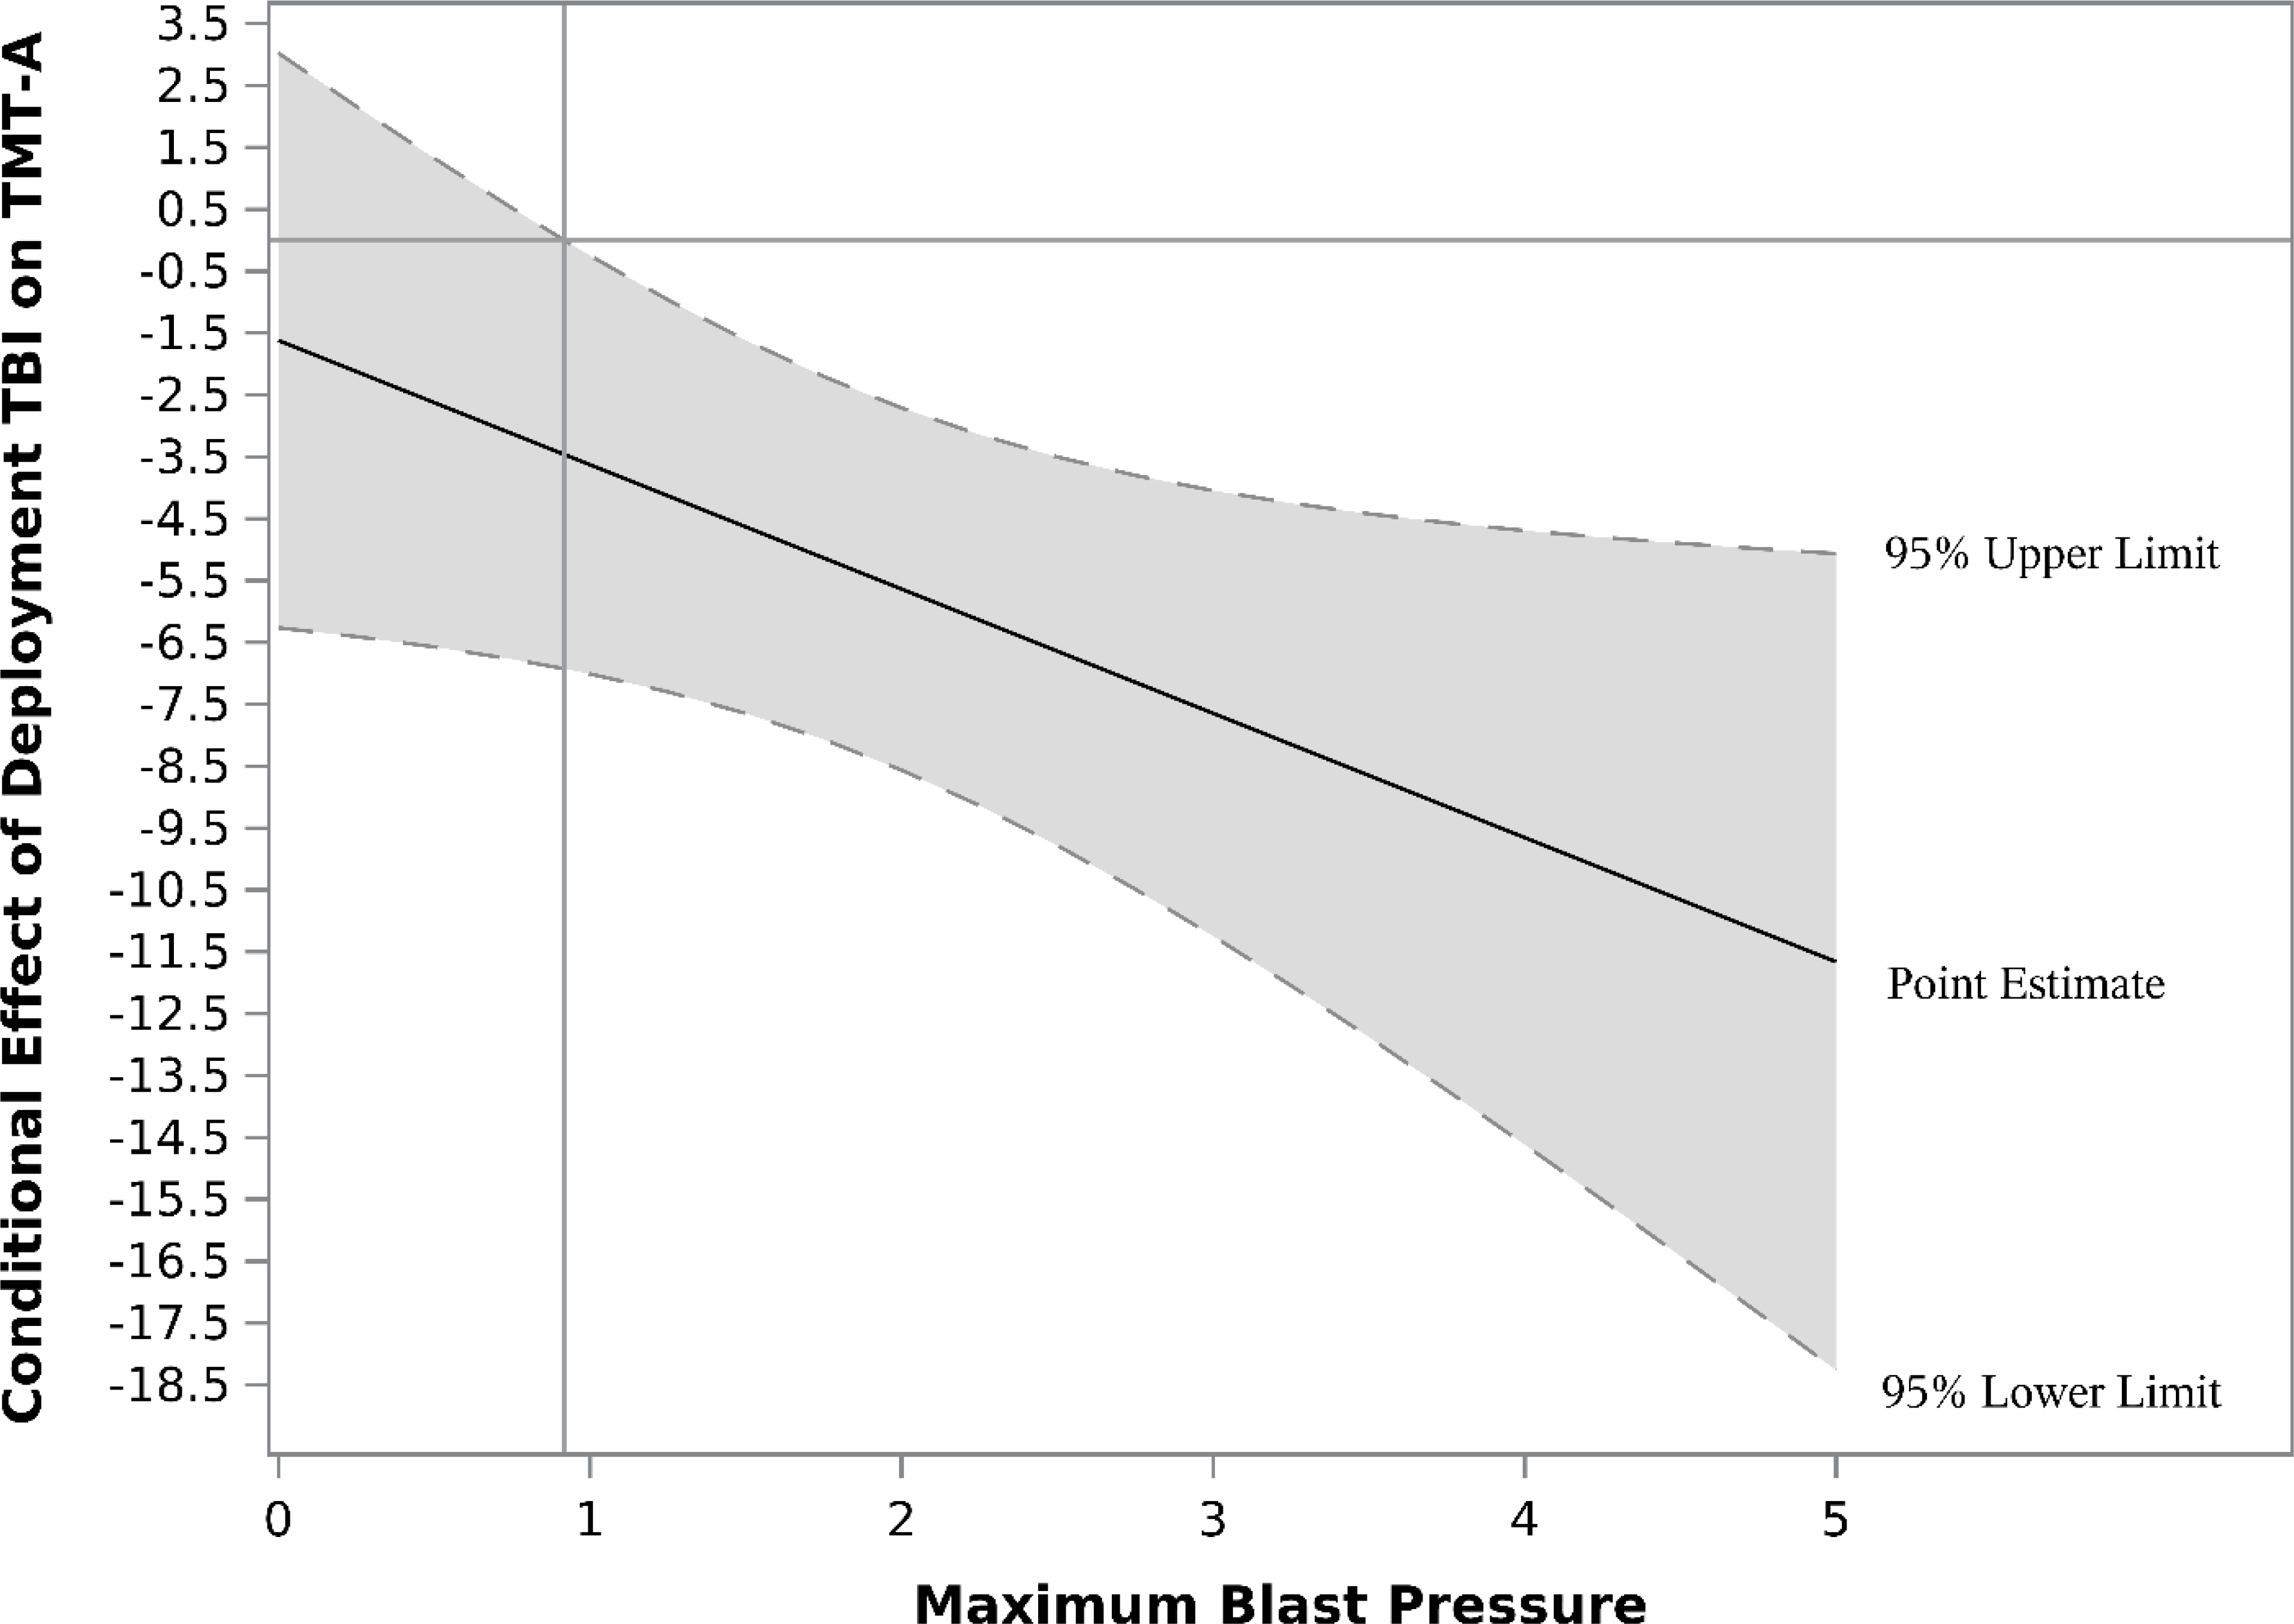
Figure 1.

Johnson-Neyman plot illustrating conditional effects of deployment TBI on Trail Making Test A (TMT-A) T-scores. Vertical reference line indicates the point at the moderator, maximum blast pressure, which the conditional effects of deployment TBI is significant (SBI pressure rating of ≥ 1). Horizontal line references an effect of zero (i.e., no conditional effect). Shaded areas represent the 95% confidence interval for effects.
