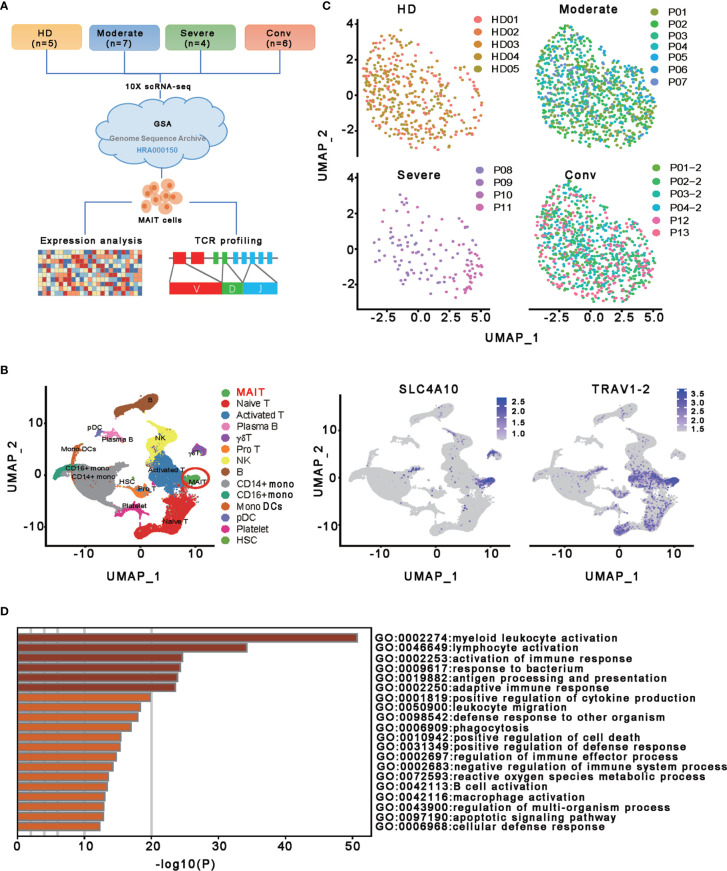
Figure 1.
Single-cell gene expression profiling of MAIT cells derived from PBMCs of the participants. (A) Schematic diagram of this study design. The scRNA−seq data for MAIT cells were processed for expression analysis and TCR profiling across four conditions, including HD (n = 5), moderate (n = 7), severe (n = 4) and conv (n = 6). (B) UMAP projection of integrated single-cell transcriptomes of 121464 cells from all participants (left) and MAIT cell annotation (right). The left scatter plot shows all 14 cell types and each dot represents a single cell, colored according to cell type. MAIT cells are circled in red. The right two scatter plots show the expression of canonical markers of MAIT cells and the cell are colored according to the expression level. (C) UMAP representations of MAIT cells in HD, moderate, severe, and conv conditions, respectively. Cells are color-coded by individual samples, respectively. (D) Gene enrichment analyses of the DEGs in the MAIT cells in comparison with 13 other immune cell types (naïve T cell, activated T cells, γδ T cells, proliferative T cells, natural killer cells, B cells, plasma B cells, CD14+ monocytes, CD16+ monocytes, monocyte-derived dendritic cells, plasmacytoid dendritic cells, platelets, and hemopoietic stem cells) in PBMCs.

