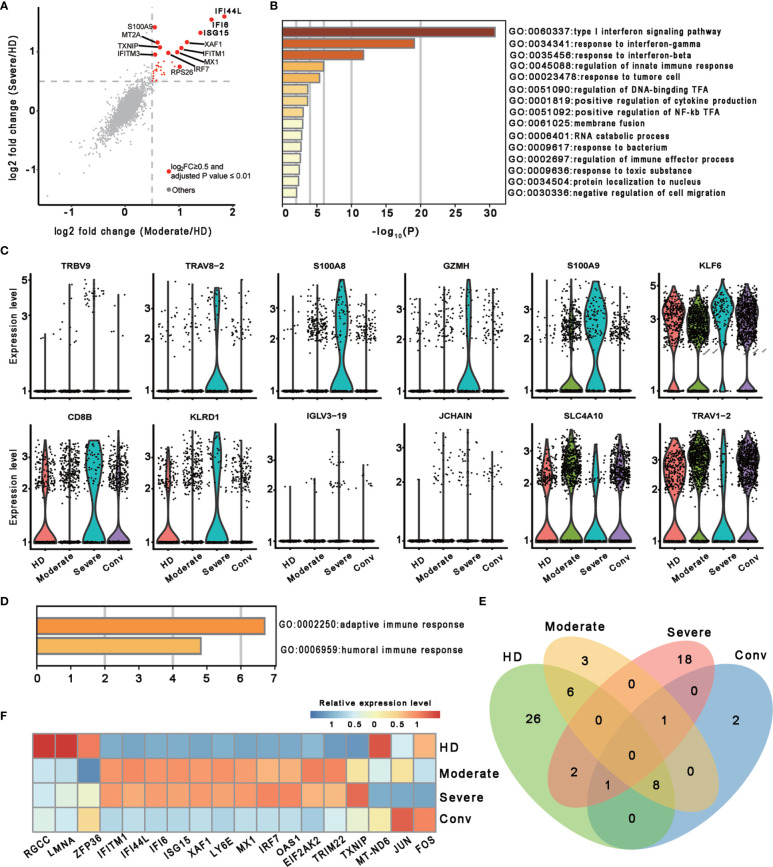
Figure 2.
Characterization of MAIT cells in individuals across four conditions. (A) Scatter plot showing the comparisons of DEGs in the MAIT cells between severe (or moderate) and HD controls. The red dots represent significantly upregulated genes with an adjusted P value ≤ 0.01 and average log2 fold change ≥ 0.5. Example genes are labeled with gene symbols. The gray dots represent genes with adjusted P > 0.01 or average log2 fold change < 0.5. A two sided unpaired Mann–Whitney U-test was applied. P values were adjusted using Bonferroni correction. (B) Gene enrichment analyses of the significantly upregulated DEGs in (A). GO terms are labeled by name and ID, and sorted by -log10(P) values. A smaller P value was expressed in a darker color. (C) Violin plots showing gene expression levels of DEGs of MAIT cells in the severe group (n = 4) in comparison with their counterparts in the moderate group (n = 7). (D) Gene enrichment analyses of the DEGs in (C). Display settings are similar to (B). (E) Venn diagram showing the overlapping DEGs among the HD (n = 5), moderate (n = 7), severe (n = 4) and conv (n = 6) conditions. (F) Heatmap showing the relative expression level of shared genes of (E) in at least two conditions. Rows denotes the four conditions and columns denote the shared genes.

