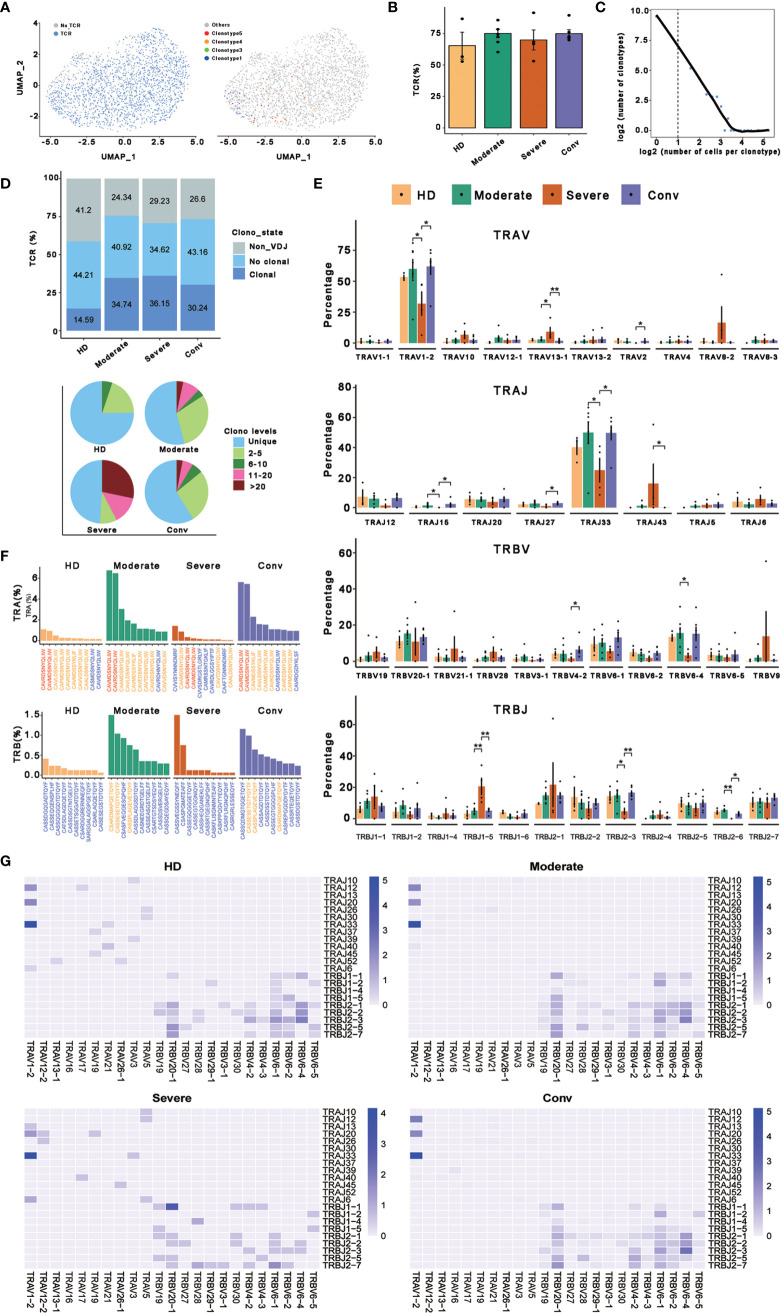
Figure 4.
Expanded TCR clone and selective V(D)J gene usage in MAIT cells. (A) UMAP of MAIT cells derived from PBMCs. Cells detected with TCRs are highlighted in blue (left) and the distributions of some types of TCR are shown (right). (B) Bar plots showing the percentage of TCR detection in each MAIT cell condition. (C) The association between the number of MAIT cell clones and the number of cells per clonotype. Nonclonal cells are on the left of the dashed line and clonal cells are on the right. These points were fitted by LOESS, which shows the negative correlation between the two axes. (D) The percentages of the clone states of MAIT cells in each condition and the distribution of different levels of clonal MAIT cells across four conditions. (E) The percentages of usage of some TRAV, TRAJ, TRBV, and TRBJ genes across four conditions in MAIT cells, in which error bars are represented by ± s.e.m. Differences in all comparisons were analyzed by the Mann-Whitney test and the results of P < 0.05 are labeled over the bar plots (0.01 < P < 0.05 is marked by ‘*’ and 0.001 < P < 0.01 is marked by ‘**’). (F) The percentages of top ten CDR3 usages in MAIT cells across four conditions are shown. Sequences in blue are distinctive usages compared with other conditions. Sequences in red are common usages across the four conditions. Sequences in orange are common usages in at least two conditions. (G) TRA/B rearrangement differences in each MAIT cell condition. The color legends in the right of these plots indicate the usage percentage of specific V-J gene pairs.

