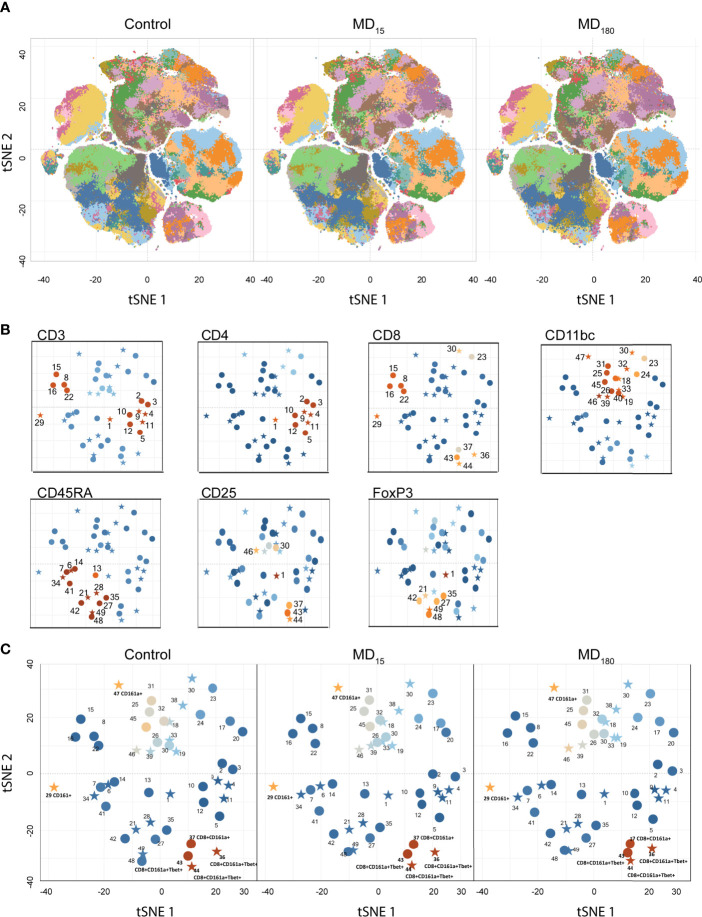
Figure 2.
Unbiased immunophenotyping with viSNE. (A) visNE map obtained through cytobank with the markers a single 13-color antibody combination. Each panel represents the mean of all 12 animals in the control (left), MD15 (middle) and MD30 (right) groups; (B) Identification of different clusters by the principal rat cell surface markers – CD3 CD4, CD8, CD11b/c, CD45RA, FoxP3. Stars represent significantly different clusters, between the different treatment groups at an FDR corrected p < 0.05; (C) Clusters colored by CD161a (NK cell marker) intensity. Blue to orange: low to high expression of the marker.

