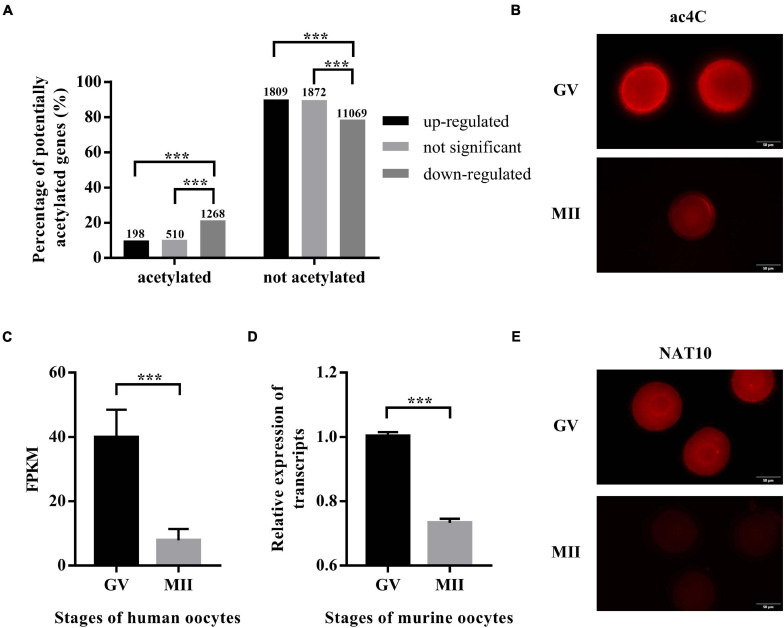
FIGURE 1.
ac4C and NAT10 levels at defined stages of oocyte meiotic progression. (A) Distribution of potential ac4C sites in differentially expressed genes between GV and MII oocytes. The numbers of genes in each category were shown above the bars. These data were obtained from GEO (GSE102113, GSE95477). (B) RNA ac4C modification during mouse oocyte maturation. Exposure time: GV, 300 ms; MII, 1.9 s. Scale bar=50 μm. (C) Transcriptional levels of NAT10 in human oocytes, logFC = –2.35. Data were obtained from GEO (GSE95477). (D) Transcriptional levels of NAT10 in mouse oocytes, logFC = –2.31. Data were obtained from GEO (GSE5668). (E) NAT10 expression during mouse oocyte maturation. Exposure time: GV, 93 ms; MII, 200 ms. Scale bar=50 μm. GV, germinal vesicle. MII, metaphase II. FC, fold change. FPKM, fragments per kilobase per million. The immunostaining was repeated in at least three independent experiments. ***Significant difference at p < 0.001.

