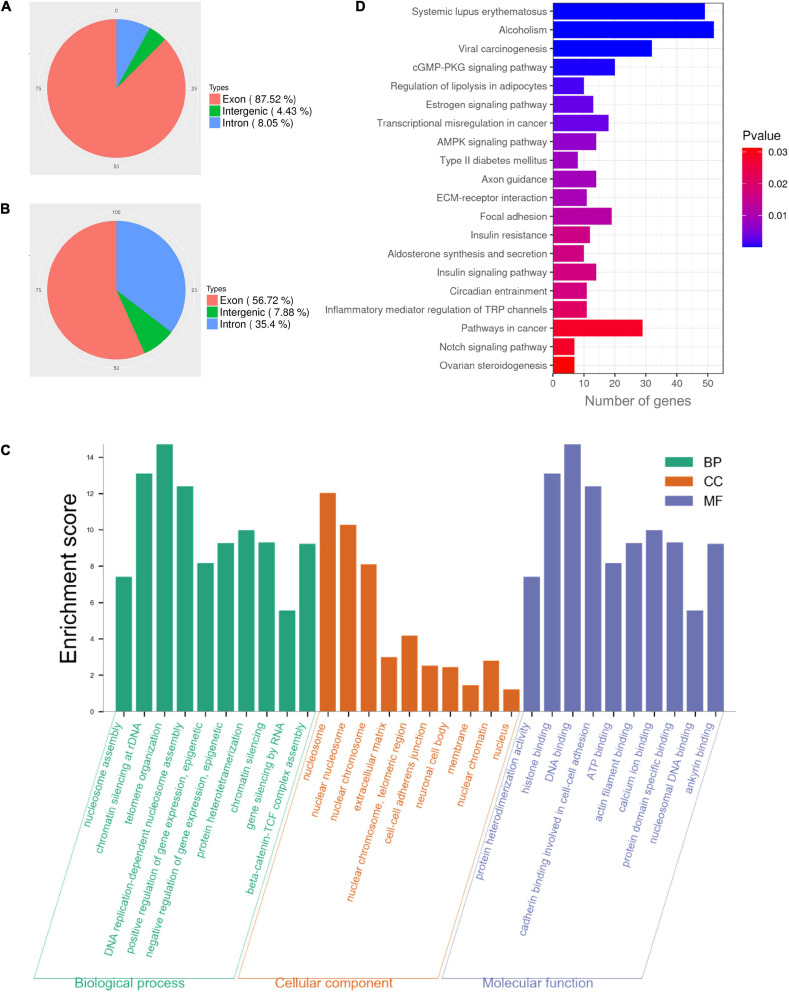
FIGURE 3.
Functional enrichment analysis of NAT10-binding transcripts in HEK293T cells. (A) Distribution of reads from input. (B) Distribution of NAT10-binding reads. (C) GO enrichment analysis of RIP-binding transcripts. (D) KEGG analysis of NAT10-RIP transcripts. RIP, RNA immunoprecipitation. GO, Gene Ontology. BP, Biological Processes. MF, Molecular Functions. CC, Cellular Components. KEGG, Kyoto Encyclopedia of Genes and Genomes.

